Weekly Price Action Trade Ideas – 26th to 30th Oct 2020
Markets Discussed in This Week’s Trade Ideas: EURJPY, USDCAD, NZDUSD and UK100.
Note: We Use Correct ‘New York Close 5 Day Charts’ – You can read about why we use these and how to download the correct free charts at Correct Free New York Close Demo Charts
EURJPY Daily Chart
-
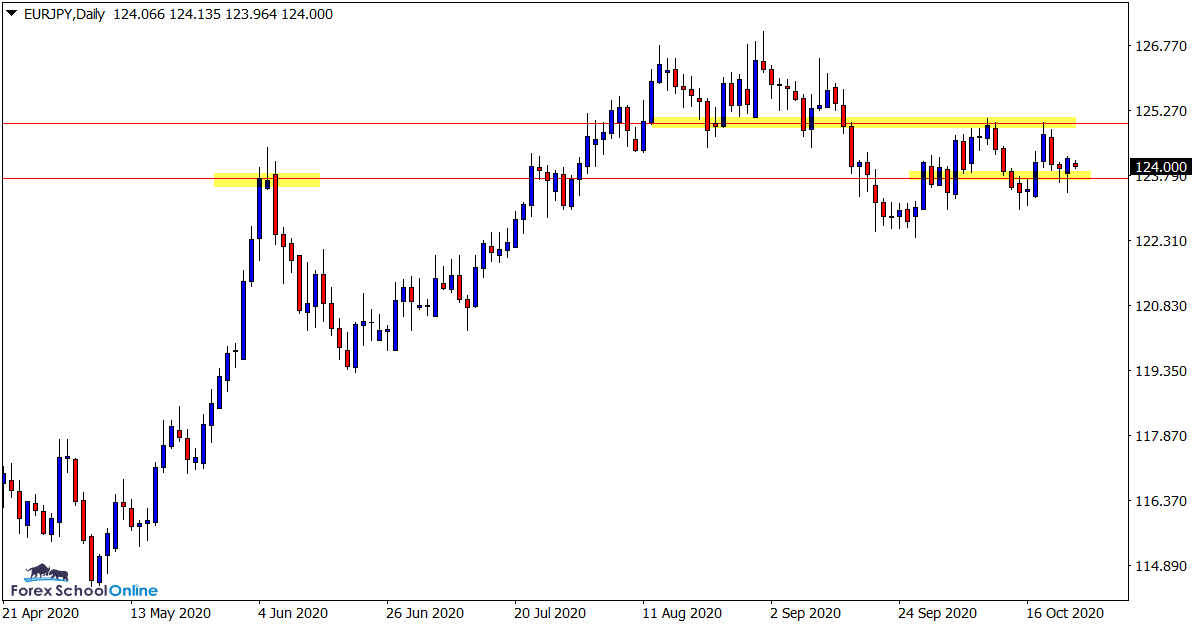
Daily Chart Bullish Engulfing Bar
Price action on the daily chart of this pair has now formed a bullish engulfing bar at a longer term support level.
If you zoom your daily chart out you will be able to see that this support level is a multi-year level going back into last year.
If price can now break the high of the engulfing bar we could look for price to move back higher and into the resistance around 124.97.
We could also then start watching for price to make a potential break of that level out higher.
Daily Chart

USDCAD Daily Chart
-
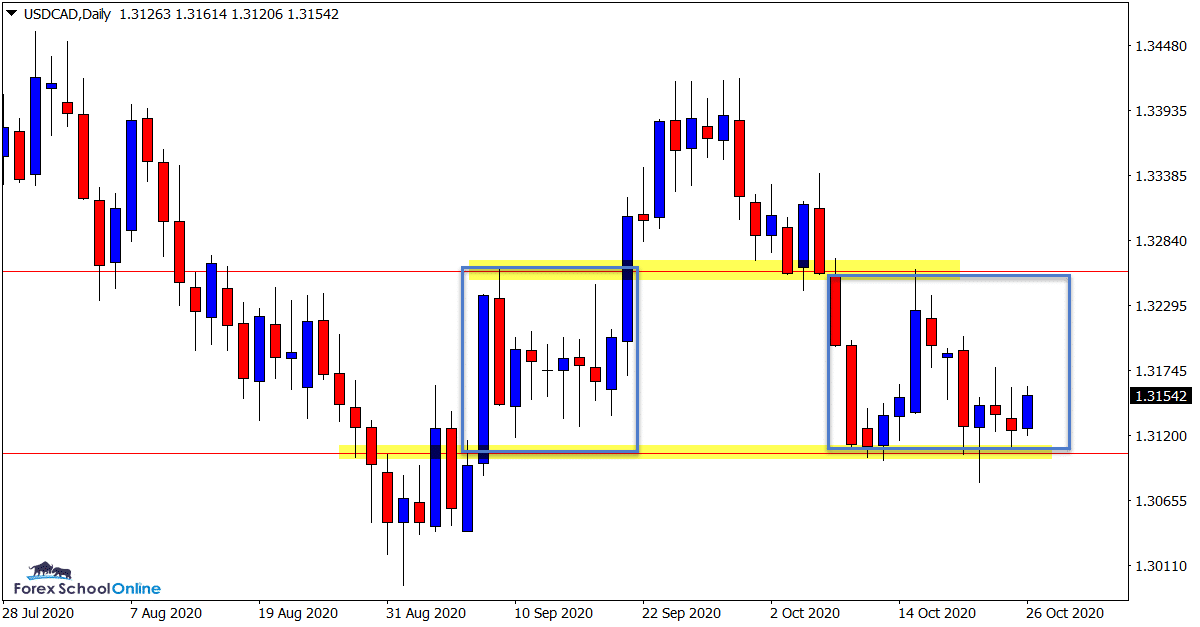
Price Has Moved Back Into Sideways Box
As we have discussed at length in recent times about this market; price is right back in the range that it was trading within a month ago.
As the daily chart shows; price was previously trading within a pretty clear box pattern and now once again we have a very similar box pattern playing out.
After forming a bullish pin bar at the range support level, price is looking to move back higher.
Whilst this box pattern continues to hold we can look to play both long and short trades at the key range support and resistance areas.
Daily Chart

NZDUSD Daily Chart
-
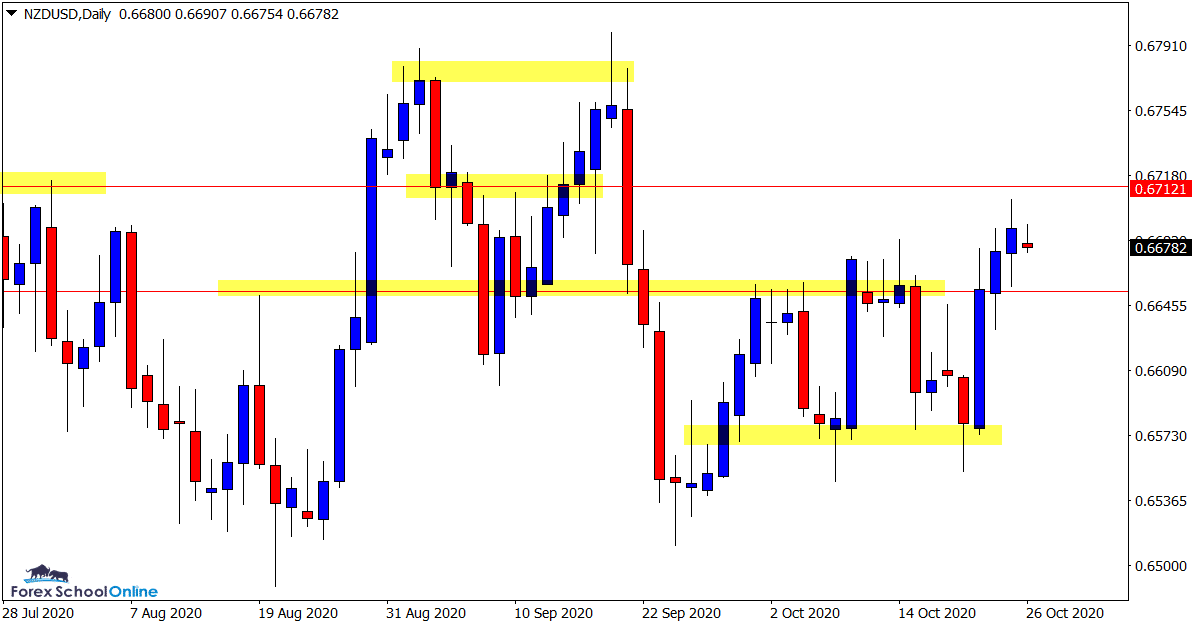
Minor Trouble Areas Everywhere
This pair looks increasingly tricky to trade at the moment.
Whilst in recent sessions we have had a nice move higher, there are minor support and resistance levels and ‘trouble’ areas all over the place.
Price has just broken out higher through one of the trouble areas, but very close overhead it faces another test with another resistance coming into play.
Whilst this market could continue the momentum higher and make a play back into the extreme highs, the best play at the moment could be to look to other markets for trading opportunities.
Daily Chart

UK100 Daily Chart
-
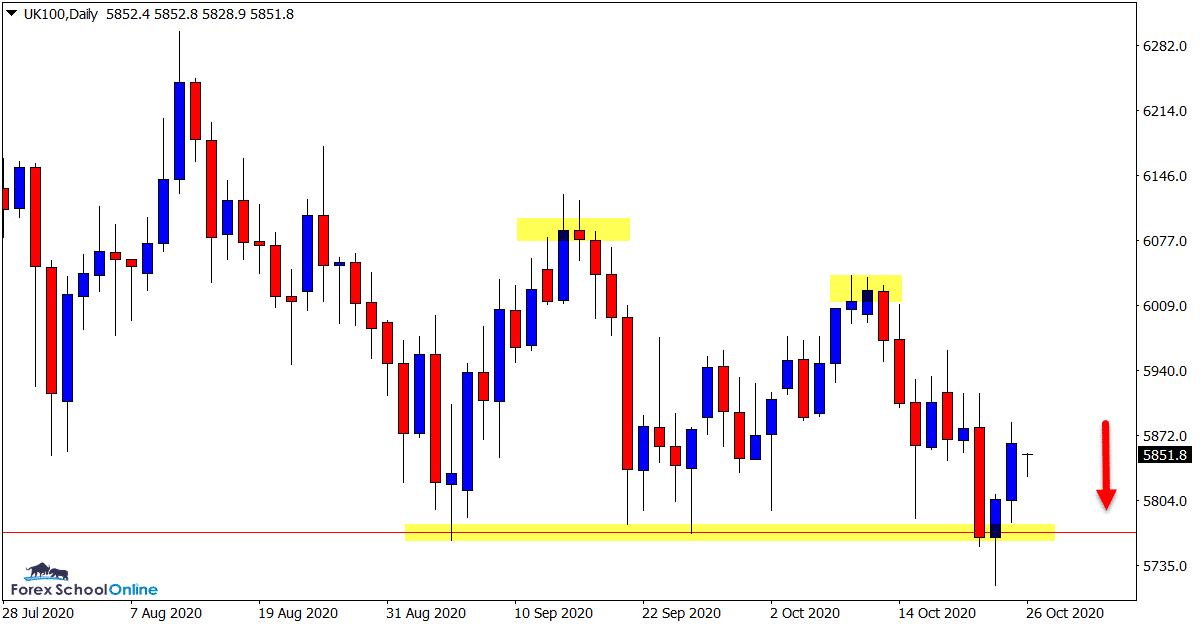
Watching For Potential Breakout Lower
As I previously discussed about this market, I am looking for potential short trading opportunities and a potential breakout lower.
Price in recent sessions has formed a series of lower highs and each time it has rejected the major support the bounce or rejection has been a little weaker.
Last week price made a serious attempt at breaking lower, only to snap back higher.
This market will be on the close watch list this week for potential breakout trades through the key support level.
Daily Chart

Trade Ideas Note: All views, discussions and posts in the ‘charts in focus trade ideas’ are the view of Forex School Online and are not recommendations or trading advice. All posts are general in nature and are not advice to buy or sell.
Note: We Use Correct ‘New York Close 5 Day Charts’ – You can read about why we use these and how to download the correct free charts at Correct Free New York Close Demo Charts
Please leave questions or comments in the comments section below;


Leave a Reply