Weekly Price Action Trade Ideas – 25th to 29th Nov 2019
Markets Discussed in This Week’s Trade Ideas: GBPUSD, NZDUSD, AUDNZD and NZDJPY.
GBPUSD Daily Chart
Trading in Ranging Box
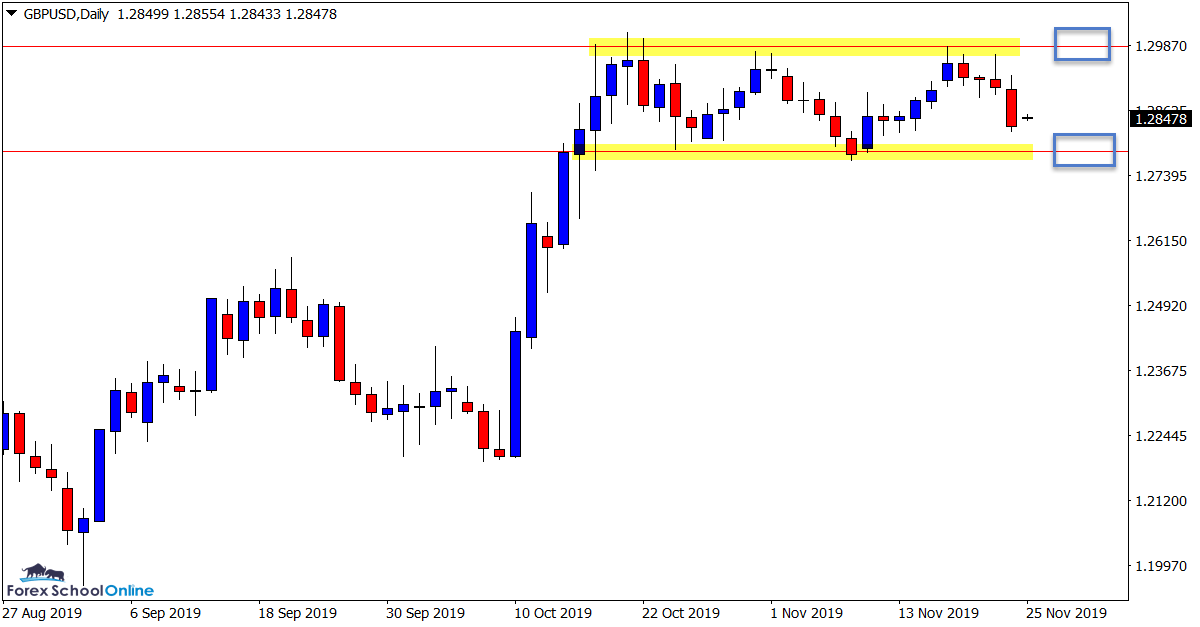
Similar to a lot of Forex pairs just at the moment, the GBPUSD is stuck trading in a fairly tight range.
The one positive about this range is that it is not as condensed and restricted as some of the other pairs. This could offer a few potential trading opportunities in the coming sessions.
If you move to your 1 hour charts you will see price has recently formed two bearish pin bars at the range high that sent price lower. Whilst this range continues to hold trades could be hunted from the range support and resistance.
The other potential setups could come when price breaks out, especially if we get a large breakout higher.
Daily Chart
NZDUSD Daily and 2 Hour Charts
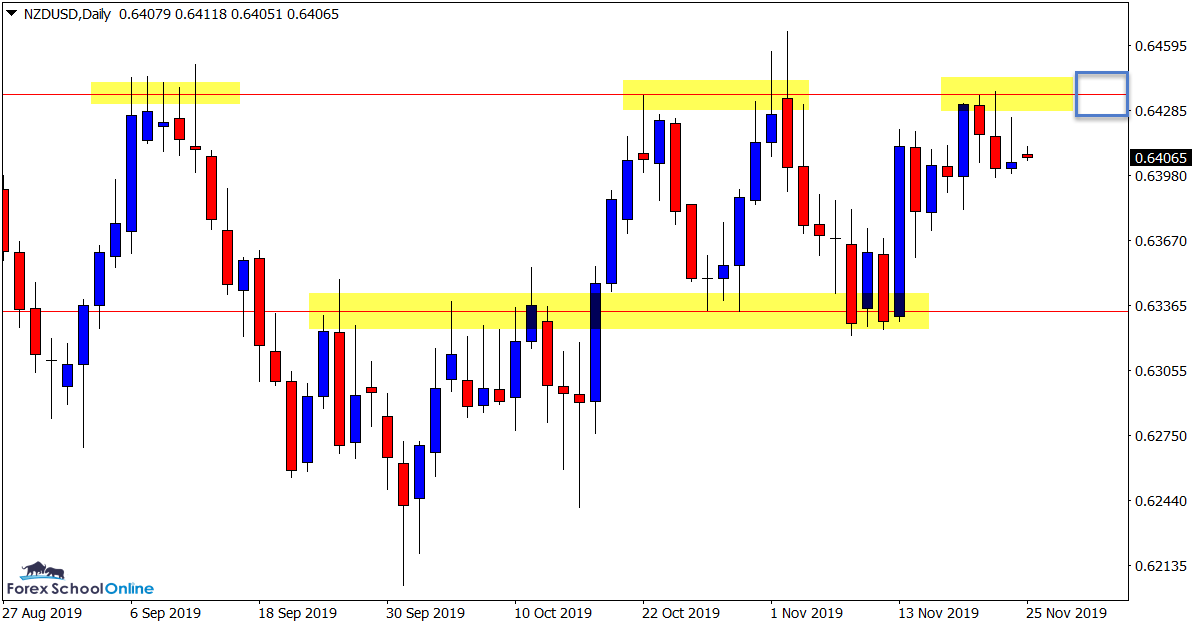
Resistance Still Key
This is a market we have been discussing and looking at a lot in recent times in the trade ideas.
Whilst it is trading sideways with no clear trend, it has been respecting its support and resistance levels and forming solid entry trigger signals.
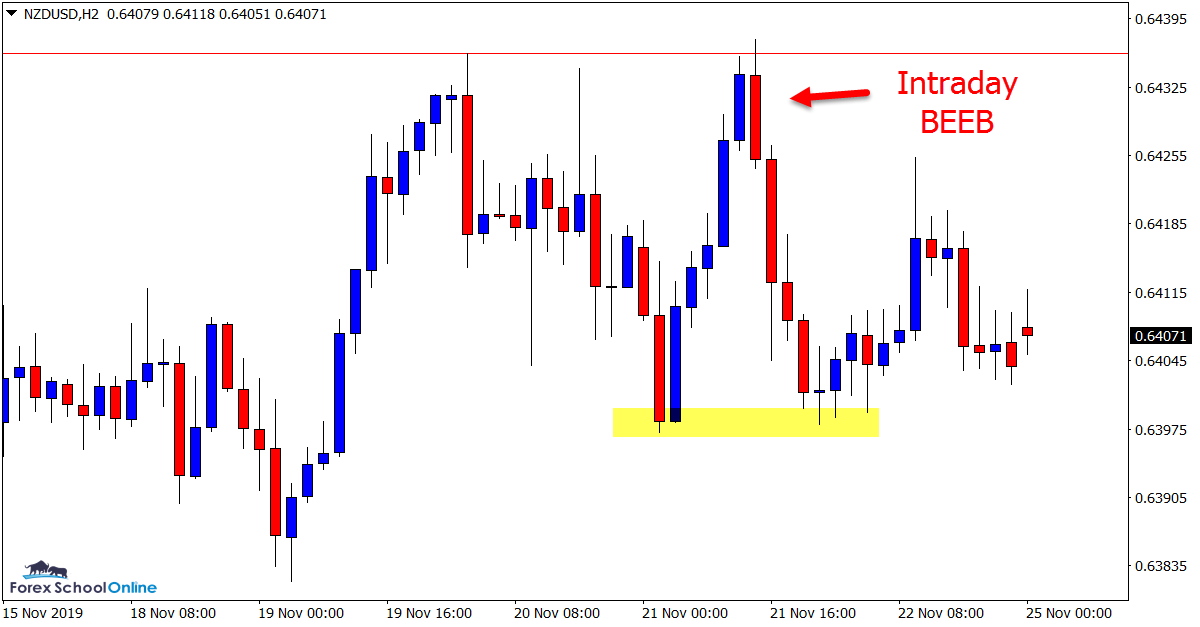
Last week we were watching the major resistance that price was looking to move into. During the week price formed a solid bearish engulfing bar on the 2 hour chart to see price roll lower into the intraday support level (see chart below).
Momentum looks to be building for a potential breakout higher with price now having formed an inside bar on the daily chart and this is sure to be a key watch this week.
NOTE: If you want to create 2 hour charts (or any extra time frames) on your MT4 charts, get the free indicator at; Create Any Time Frames on MT4
Daily Chart
2 Hour Chart
NZDJPY Daily and 1 Hour Charts
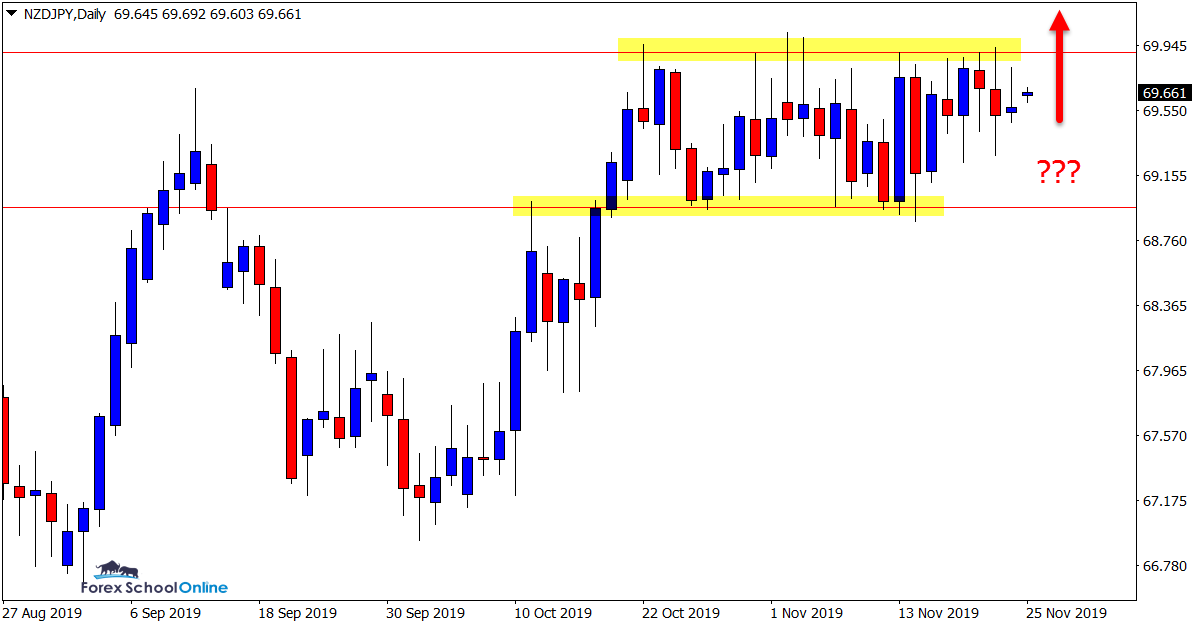
Waiting For Breakout
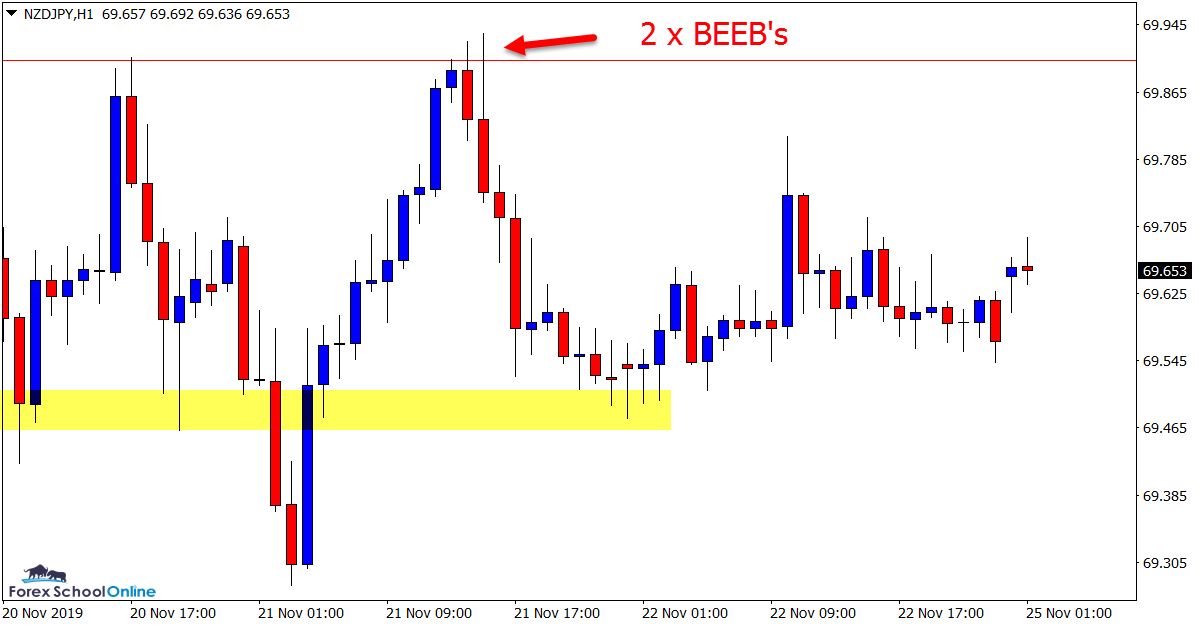
In last week’s trade ideas we looked at this pair and the possibility for a potential range trade or breakout, similar to this week’s idea on the GBPUSD.
We also discussed how tricky these markets can be when price is trading within such tight ranges because even if you get the direction right, you can often be whipsawed out of your trade before price goes in your direction. This is simply because when price is not making free flowing moves it is a lot more likely to chop up and down.
We saw that play out on the intraday charts with price forming two engulfing bars. The first would have had its stop taken out before the second made a solid move lower into the intraday support.
The most conservative play in this market looks to be continuing to wait for the breakout trade to play its hand.
Daily Chart
1 Hour Chart
AUDNZD Daily Chart
Watching For Pullback Into Resistance
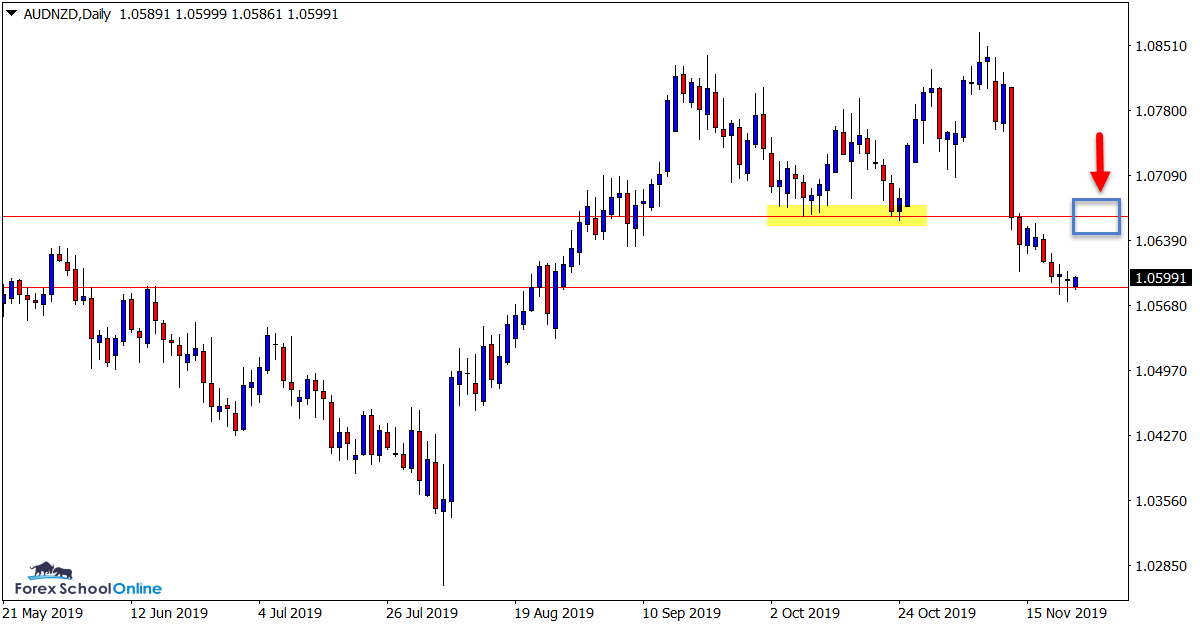
Recently we have seen price on the AUDNZD aggressively move below a key support level on the daily chart.
As the daily chart shows below; price smashed through the support level that has also acted as a resistance level in recent years.
If price can rotate higher back into this level it could be a good level to watch on higher time frames such as the daily and 4 hour charts for potential short trades.
Daily Chart
Note: We Use Correct ‘New York Close 5 Day Charts’ – You can read about why these are important and how to download the correct free charts at Correct Free New York Close Demo Charts
Trade Ideas Note: All views, discussions and posts in the ‘charts in focus trade ideas’ are the view of Forex School Online and are not recommendations or trading advice. All posts are general in nature and are not advice to buy or sell.
Please leave your questions or comments in the comments section below;


Leave a Reply