Weekly Price Action Trade Ideas – 24th to 28th August 2020
Markets Discussed in This Week’s Trade Ideas: EURUSD, CADJPY, AUDSGD, and GOLD.
Note: We Use Correct ‘New York Close 5 Day Charts’ – You can read about why we use these and how to download the correct free charts at Correct Free New York Close Demo Charts
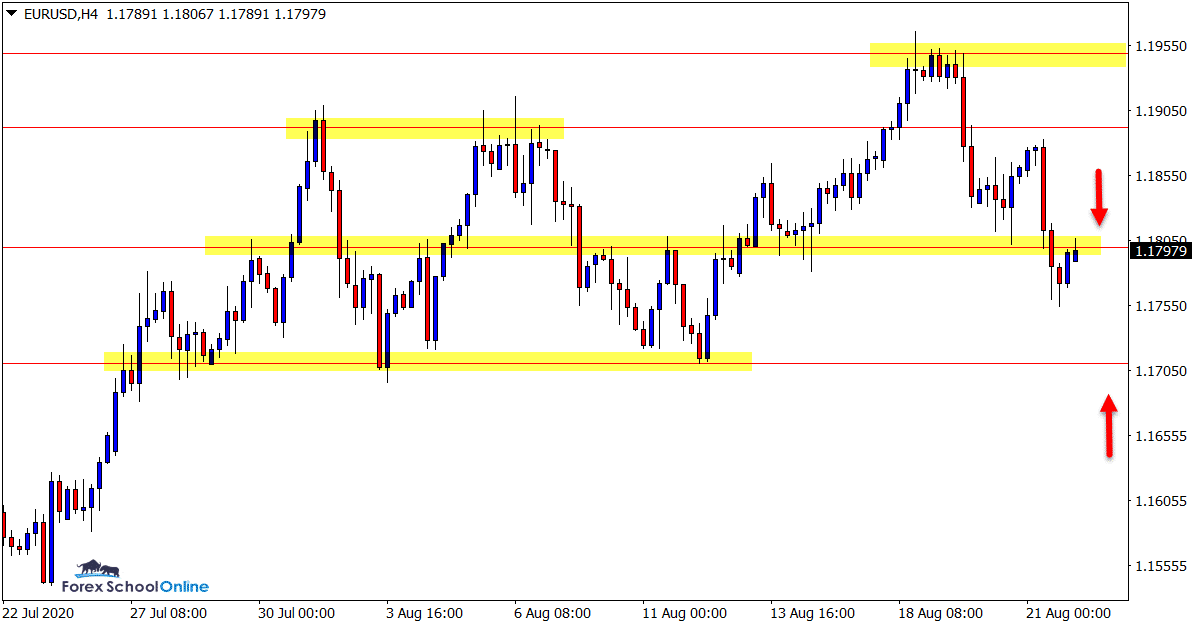
EURUSD 4 Hour Chart
Price Makes False Break
Price attempted a breakout higher in this pair last week that turned into a fakeout with a daily bearish 2 bar reversal.
Price was looking to breakout higher and through what has been a tight ranging period.
Now price has moved back lower into the range, more sideways price action could play out.
In the short-term the intraday price flip level we discussed last week looks important. If it holds as a new resistance it could contain prices lower.
4 Hour Chart

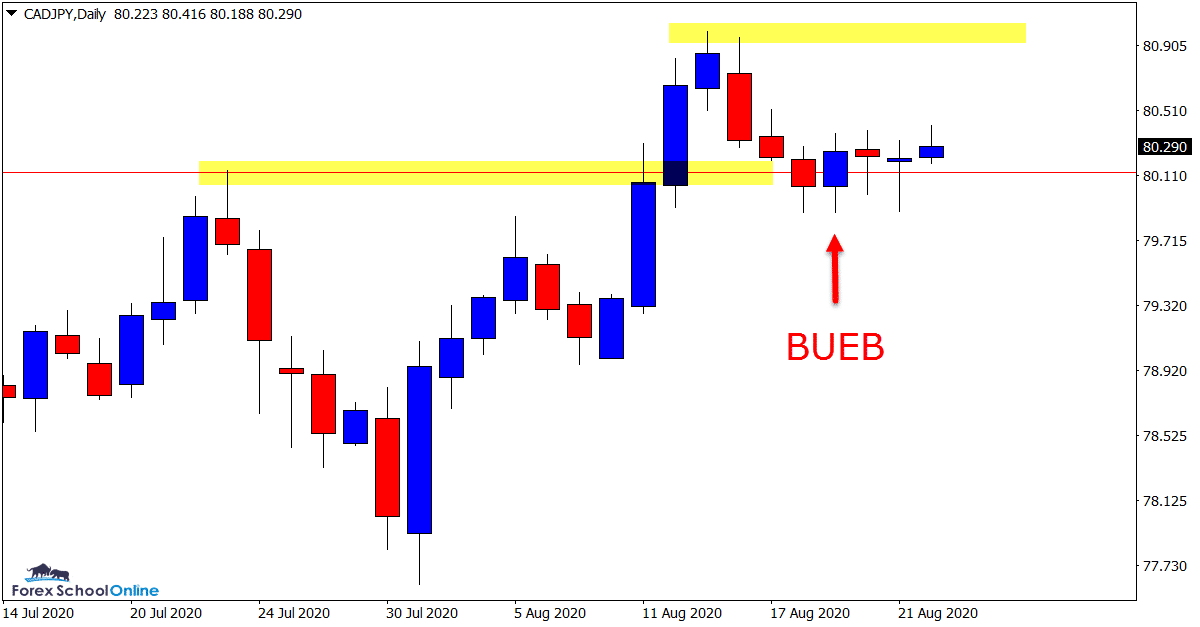
CADJPY Daily Chart
Price Flip Holding
We discussed this market heavily last week and the fact that price was looking to pullback into the major support level and 50% Fibonacci level.
Now price has pulled back into this level we can see a bullish engulfing bar and rejection candles have formed rejecting the support.
As yet there has been little follow through and for a move back into the recent swing high we will need to see the recent daily highs taken out.
Daily Chart

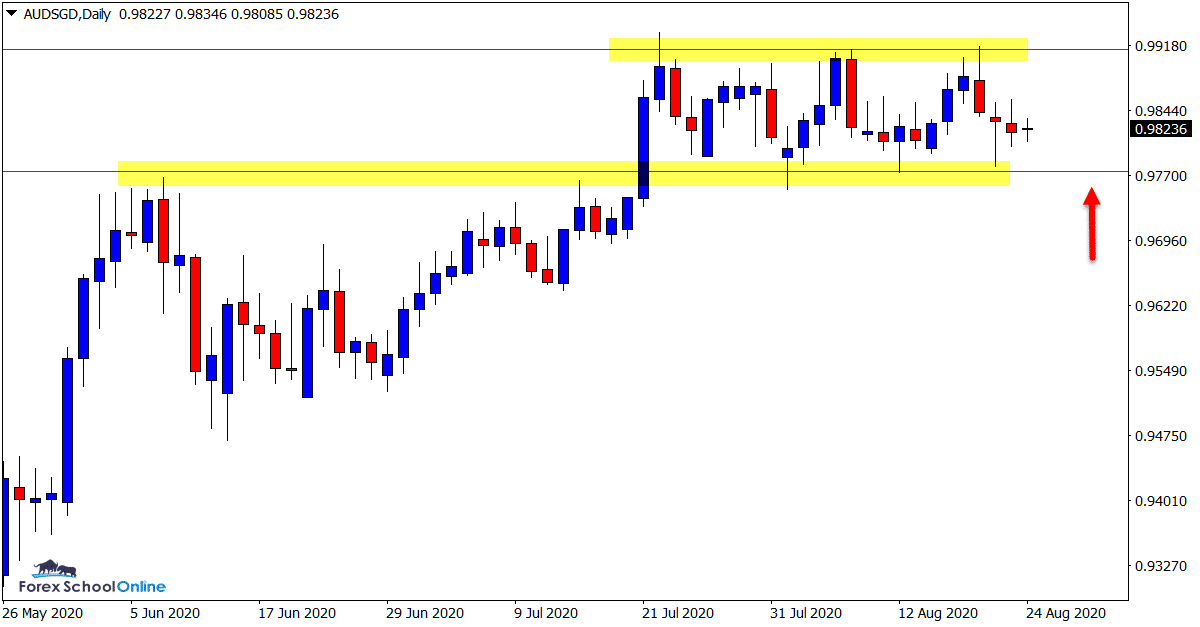
AUDSGD Daily Chart
Sideways Box Still Yet to Break
This pair is currently stuck in a sustained period of consolidation and is trading within a very tight box.
Aggressive traders could be looking to find trades from the resistance and support levels on the smaller time frames until these levels break.
More conservative traders should be sitting on the sidelines until there is a clear break and more free-flowing price action begins forming.
Daily Chart

GOLD 4 Hour Chart
4 Hour Pin Bar
After forming some explosive price action in both directions recently, price has cooled off and is in consolidation mode.
As the 4 hour chart shows; price has formed a bullish pin bar at the recent price flip support level, followed by an inside bar.
This intraday support level looks key for this market and an important level to watch in the coming sessions.
A break lower and price would be open to fall into the recent swing lows. For any move back higher there is a very close intraday resistance level that price would have to break through.
Daily Chart

Trade Ideas Note: All views, discussions and posts in the ‘charts in focus trade ideas’ are the view of Forex School Online and are not recommendations or trading advice. All posts are general in nature and are not advice to buy or sell.
Note: We Use Correct ‘New York Close 5 Day Charts’ – You can read about why we use these and how to download the correct free charts at Correct Free New York Close Demo Charts
Please leave questions or comments in the comments section below;


Leave a Reply