Weekly Price Action Trade Ideas – 23rd to 27th September 2019
Markets Discussed in This Week’s Trade Ideas: AUDSGD, GBPNZD, SILVER and OIL.
AUDSGD Daily Chart
Testing Major Support
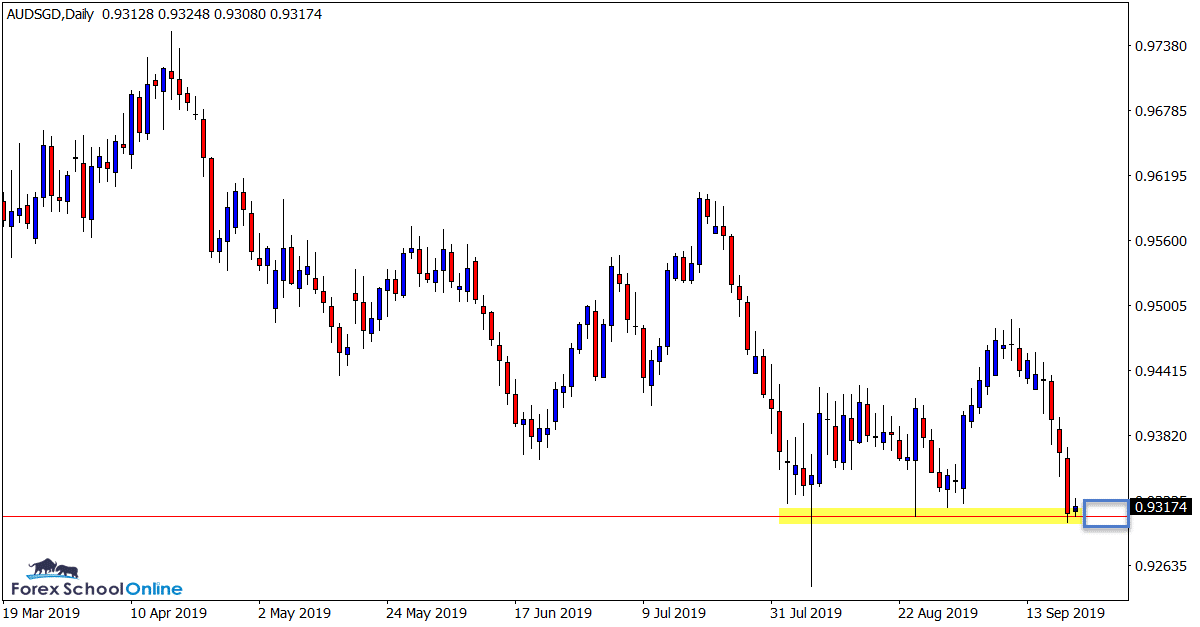
In the last two weeks we have seen some free flowing moves in this pair with price making multiple attempts at the major support level.
As the daily chart shows below; price is now once again looking to test this support level with a potential breakout lower.
On the previous two occasions price was at this level we had a large false break pin bar and bullish engulfing that sent price back higher.
On both of these occasions price had not moved as aggressively into the support as what it has on this occasion.
This level looks to be key and if it gives way it could open the door for fast break trade setups.
Daily Chart
OIL v USD Daily Chart
Price Flip Support Holding
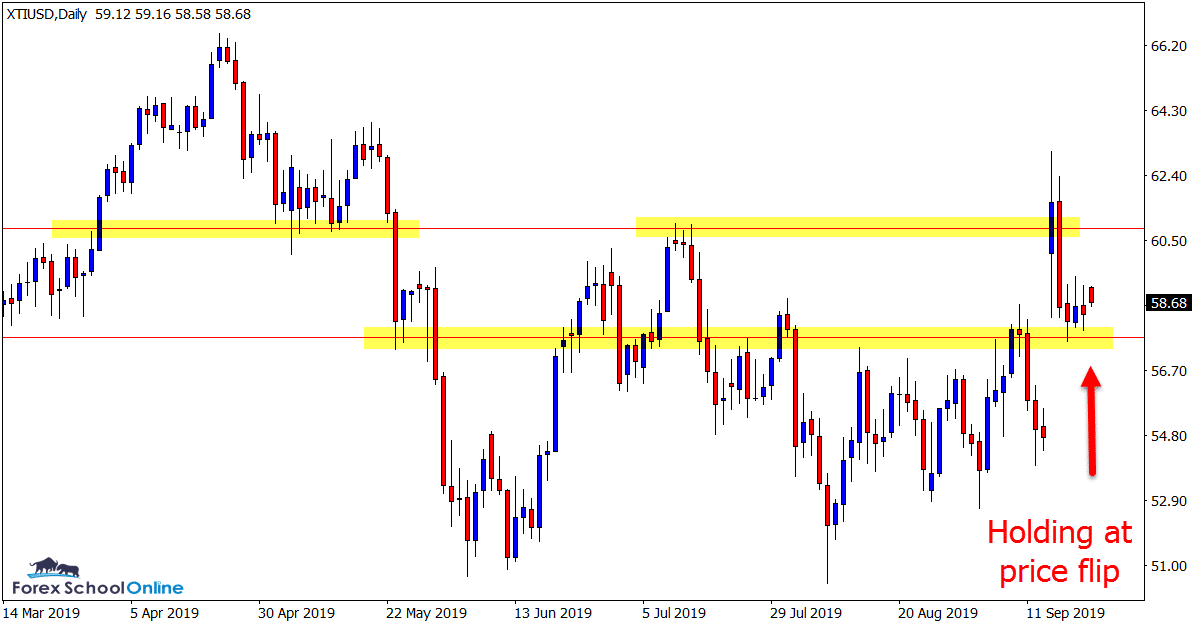
A pretty hectic week for this market last week. Price first smashed out higher and was looking like racing to the sky, before running into resistance and bouncing back lower.
We can see that price action calmed down, but it was also able to hold above what was the old resistance and now new price flip support level.
Since this large two day move price has been in consolidation mode, trading sideways and sitting on the price flip support.
If this level holds we could get a new test of the resistance and potential break higher.
Daily Chart
GBPNZD Daily and 30 Minute Charts
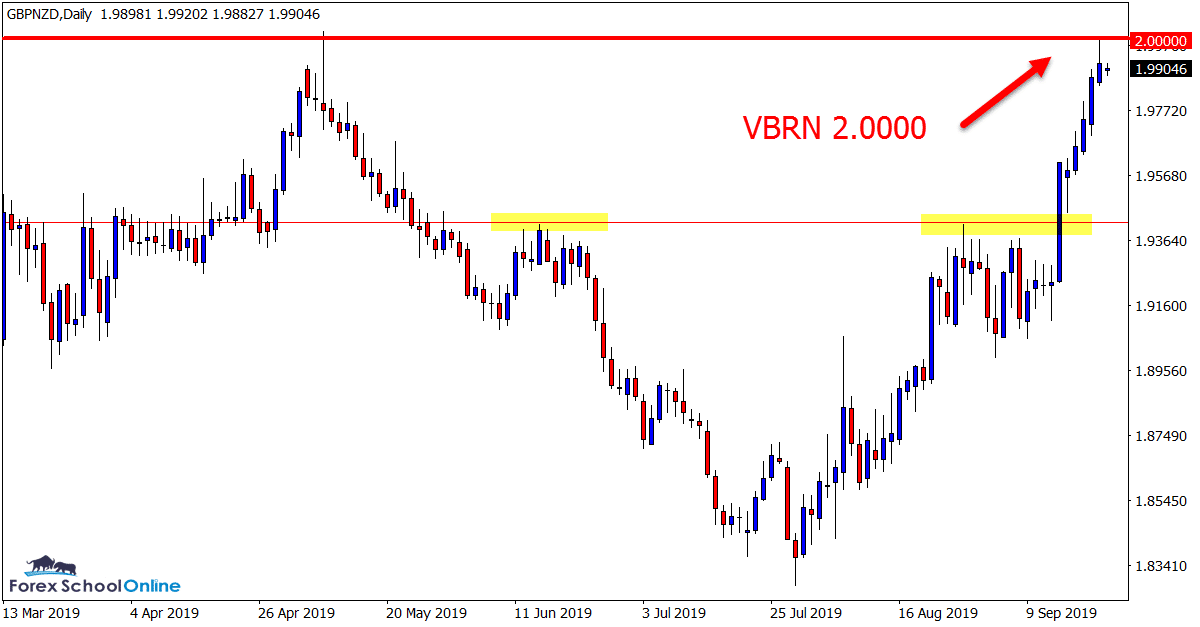
Intraday 2 Bar Reversal Sends Price Into Very Big Round Number
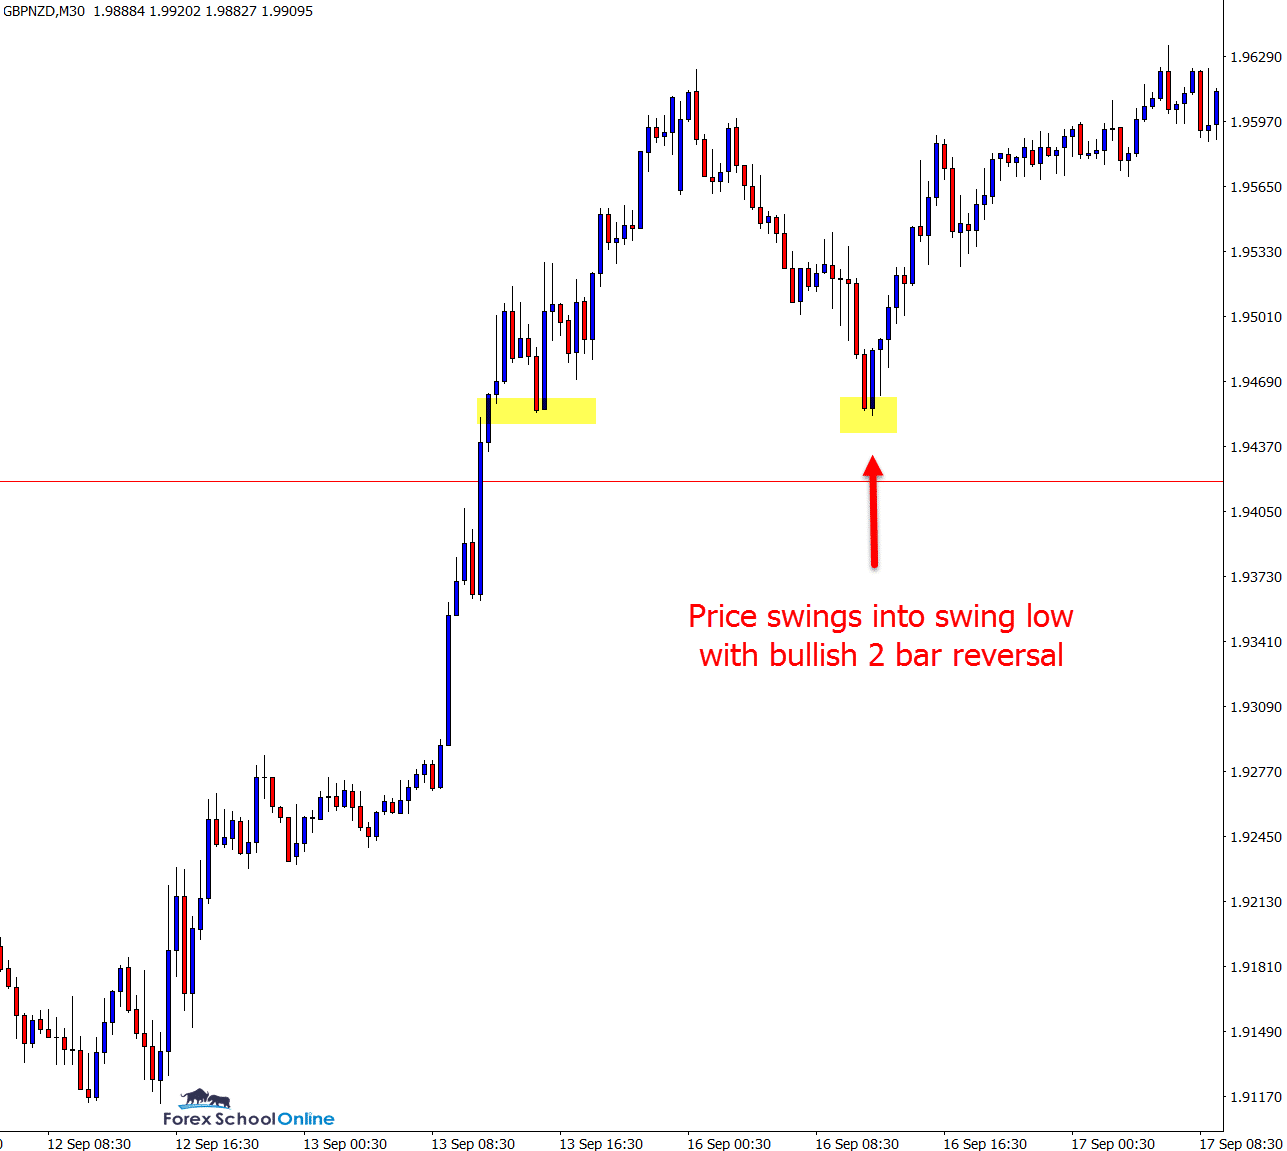
In last week’s trade ideas we were looking for a quick rotation lower into the same area price had just made an aggressive breakout higher through.
After price makes these quick breakouts it will often either pause, or make a quick retracement into value before continuing with the breakout move.
On the daily chart we can see in the next session after breaking out price rotated lower.
One thing to note is that price did not make it all the way back to the pip to the support level. As we have often discussed; this is very common on these fast breaks. Price will often pause or move back to the first level of support or resistance and then continue with the breakout.
Aggressive intraday traders would have taken note that price rotated into the most recent swing low and most recent area price found support before forming a 2 bar reversal and continuing back higher.
Daily Chart
30 Minute Chart
SILVER vs USD Weekly and Daily Charts
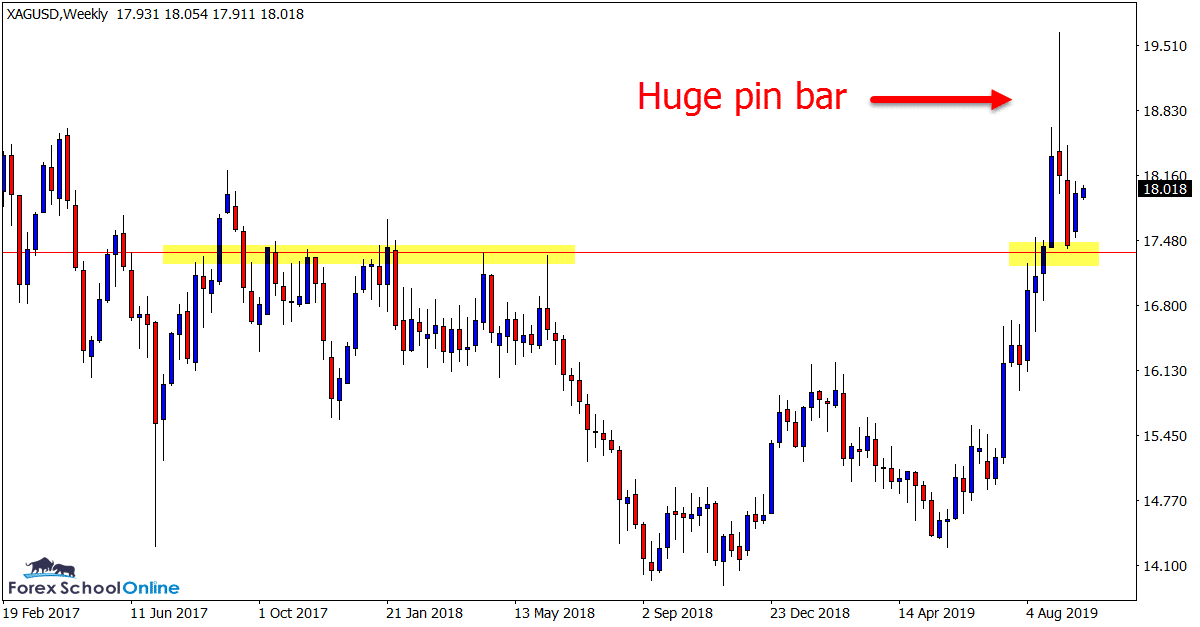
Weekly Pin Bar Sends Price Into Support
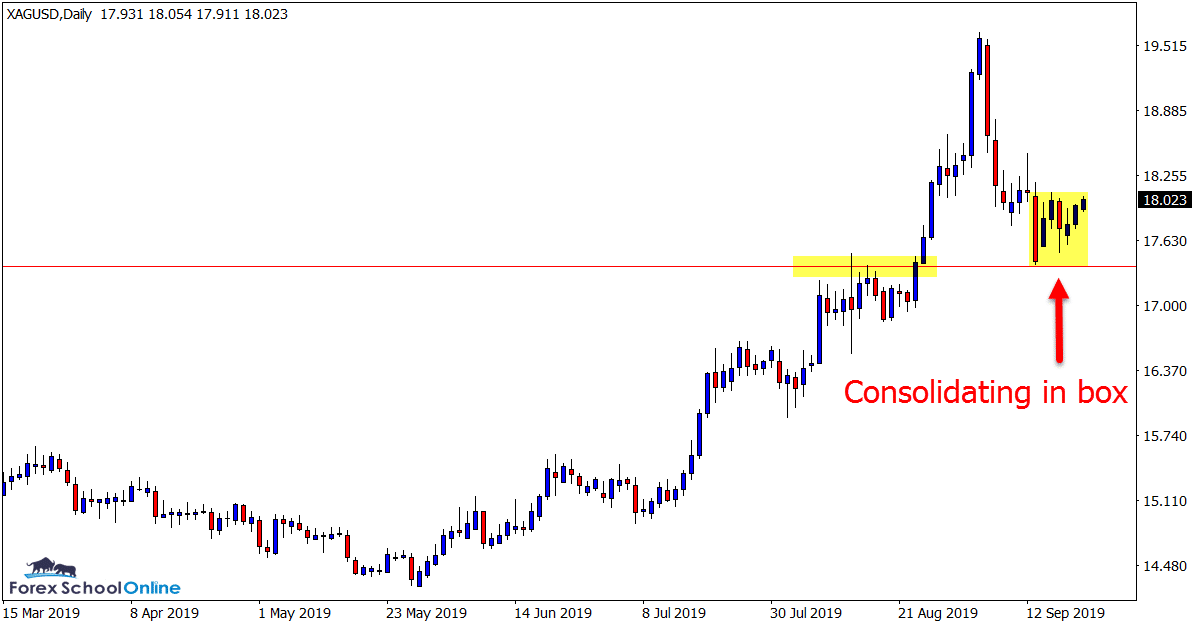
Two weeks ago we discussed this market and the large weekly pin bar price had formed against the trend.
Price has since broken lower below this pin bar and is now testing the major support levels.
The next few sessions look to be crucial for where price makes it next major move in this market.
On the daily chart we can see that the last five completed candles have not been able to break the high or low of the large bearish candle that moved into support.
The up-trend is still intact at this time, but we will need to see this high taken out and price make a new leg back into the swing high resistance, looking to make a new higher high.
Weekly Chart
Daily Chart
Note: We Use Correct ‘New York Close 5 Day Charts’ – You can read about why we use these and how to download the correct free charts at Correct Free New York Close Demo Charts
Trade Ideas Note: All views, discussions and posts in the ‘charts in focus trade ideas’ are the view of Forex School Online and are not recommendations or trading advice. All posts are general in nature and are not advice to buy or sell.
Please leave questions or comments in the comments section below;


Leave a Reply