Weekly Price Action Trade Ideas – 23rd to 27th Nov 2020
Markets Discussed in This Week’s Trade Ideas: GBPAUD, EURGBP, GER30 and CHFJPY.
Note: We Use Correct ‘New York Close 5 Day Charts’ – You can read about why we use these and how to download the correct free charts at Correct Free New York Close Demo Charts
GBPAUD Daily Chart
-
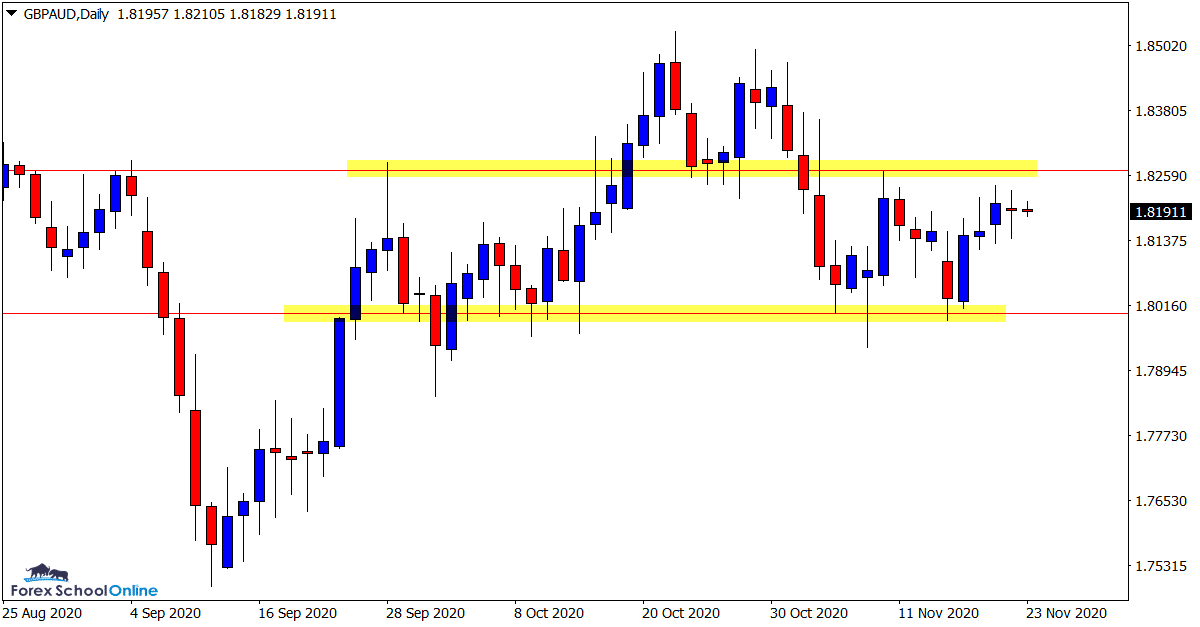
Daily Chart Inside Bar
Price on this pair has now formed a daily chart inside bar.
This inside bar is inline with the recent price action story with price stuck contained within a sideways box in the last two weeks of trade.
Overall price is also stuck within a large range trading pattern.
Very aggressive traders could be watching for this inside bar and overhead resistance to breakout higher in the coming sessions with a new leg into the range high.
Daily Chart

EURGBP Daily Chart
-
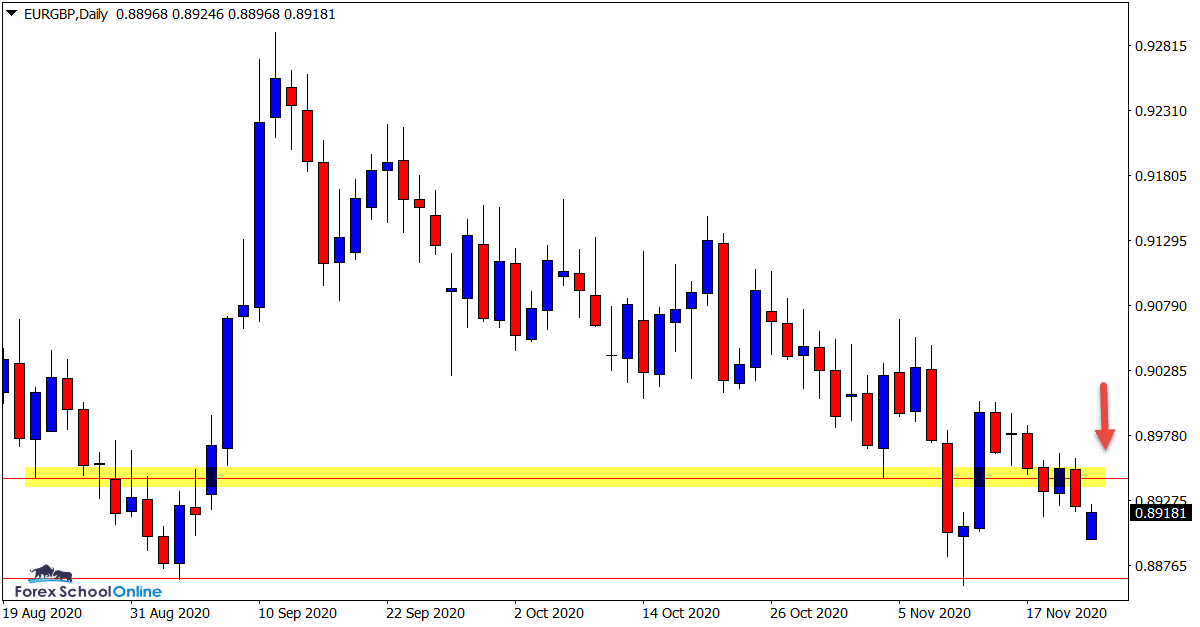
Price Flip Resistance Looks Key
Price has been slowly grinding it’s way lower on this pair.
As the daily chart shows, whilst there has been a steady decline and move lower, there has not been a textbook trend. We have not seen a series of lower highs or lower lows consistently forming.
Price is now looking to break lower and move into the major support level.
If the overhead price flip resistance holds, then it could be a solid level to look for short trades in the coming sessions.
Daily Chart

CHFJPY Daily Chart
-
Will Support Break?
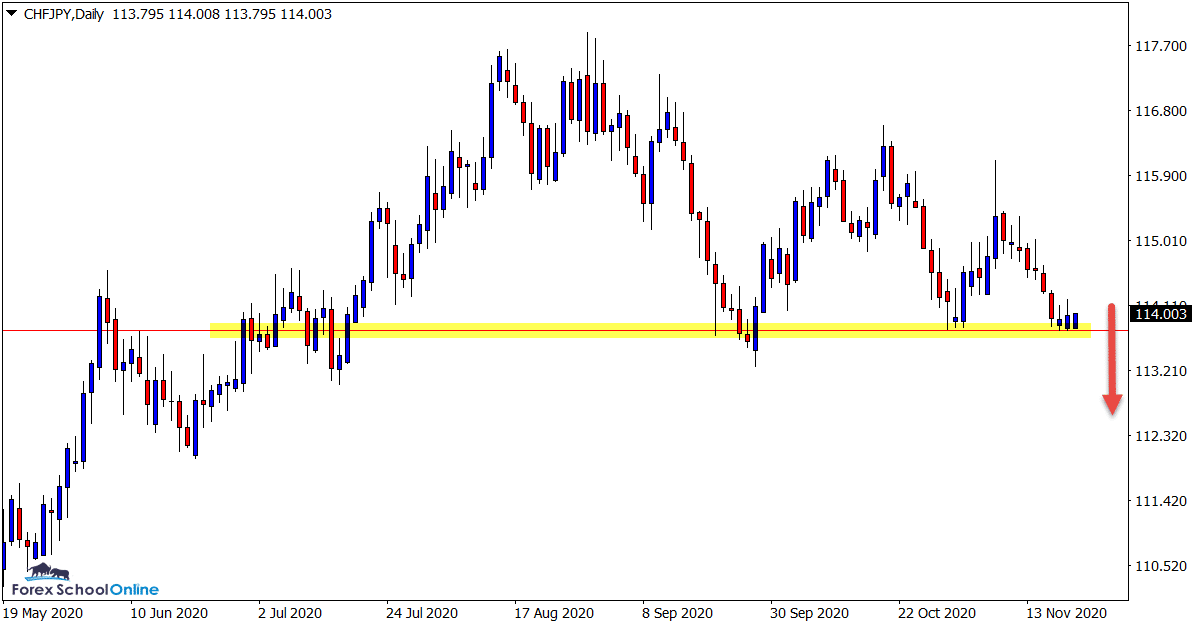
This pair is sitting right on top of a major daily chart support level.
As the daily chart shows, price in recent times has rejected this level twice with strong moves back higher. The first time we saw price form an engulfing bar and move higher and recently and inside bar with another strong move higher.
So far we have not seen the same rejection of this level.
If price can break this level in the next few sessions, then we can start to look for potential short breakout trades.
Daily Chart

GER30 Daily Chart
-
Box Pattern Looking to Break
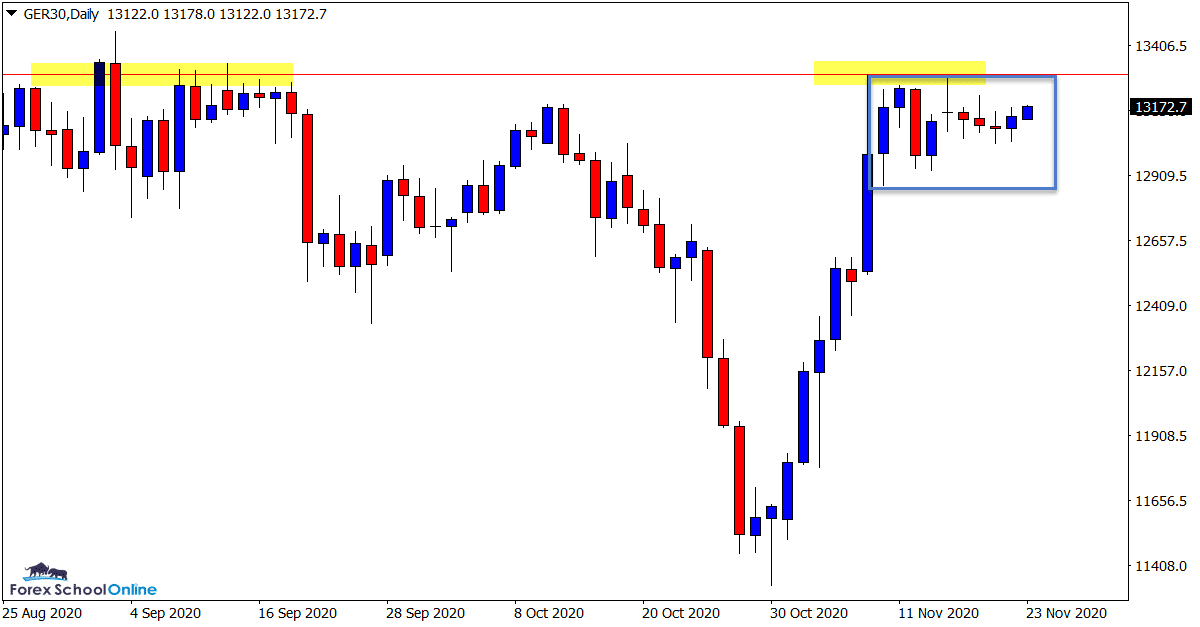
Price in this market is trading in a very tight consolidation box pattern.
This is best shown on the daily chart.
The high of this box is also the major daily chart resistance level and a level that has been holding as a key resistance level all year.
If we can see price break this level in the coming sessions, then we can start to look for long breakout trades and a new large leg higher.
Daily Chart

Trade Ideas Note: All views, discussions and posts in the ‘charts in focus trade ideas’ are the view of Forex School Online and are not recommendations or trading advice. All posts are general in nature and are not advice to buy or sell.
Note: We Use Correct ‘New York Close 5 Day Charts’ – You can read about why we use these and how to download the correct free charts at Correct Free New York Close Demo Charts
Please leave questions or comments in the comments section below;


You are awesome your analysis are perfecy