Weekly Price Action Trade Ideas – 23rd to 27th March 2020
Markets Discussed in This Week’s Trade Ideas: EURGBP, AUDNZD, GBPCHF and GOLD.
Note: We Use Correct ‘New York Close 5 Day Charts’ – You can read about why we use these and how to download the correct free charts at Correct Free New York Close Demo Charts
EURGBP Daily and 4 Hour Charts
Price Pulls Back Lower
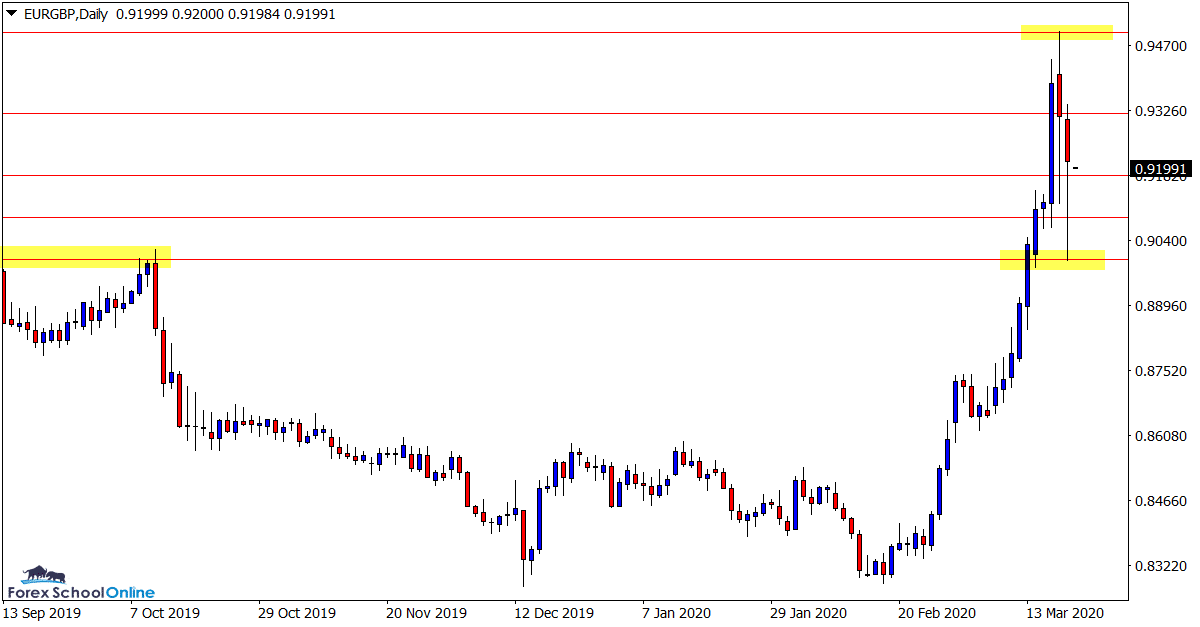
In last week’s trade ideas we were watching to see if price would hold at the minor price flip support for a new move into the extreme highs.
After testing resistance levels from 15 years ago, price has since rotated back lower into the daily support level.
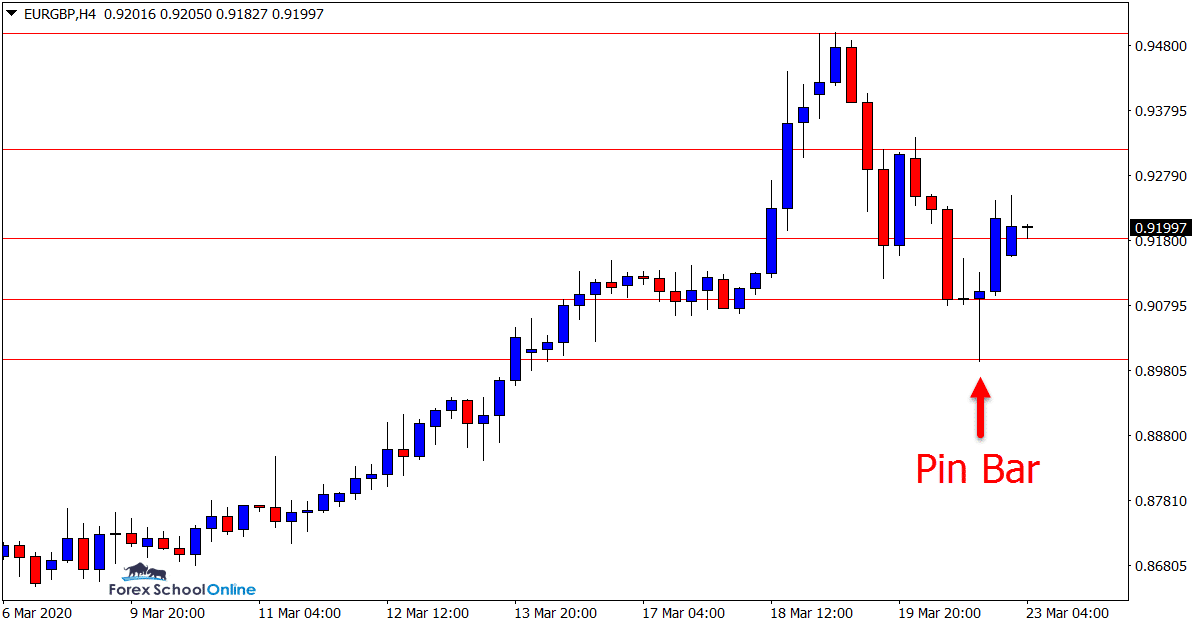
As the 4 hour chart shows below price has formed a bullish pin bar at the daily support.
If price gains momentum from this pin bar we could see price once again test the 0.9320 area and then the swing high created from last week.
Daily Chart
4 Hour Chart
AUDNZD Daily Chart
Will Price Pop Higher?
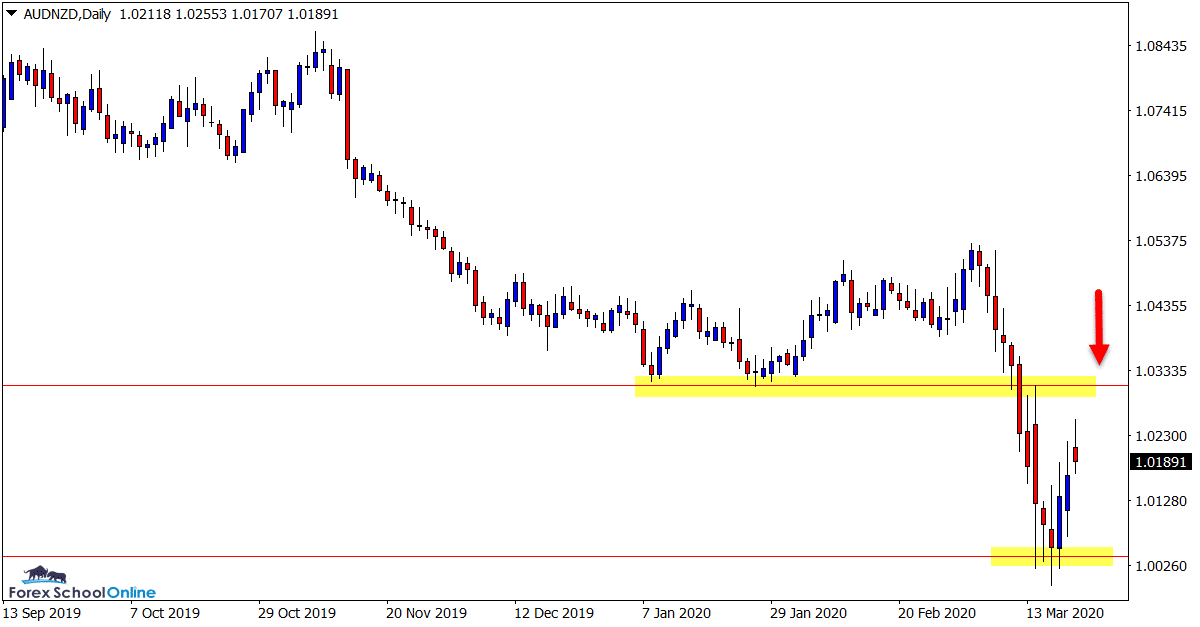
With markets going crazy we are still seeing most respect their major daily levels.
This market is a good example of this with price first holding above the support, then smashing through and falling directly into the key resistance before stalling.
Price has now popped higher and could look to rotate back into the old support level. This level could look to act as an old support and possible new price flip resistance for potential bearish trades.
Daily Chart
GBPCHF Daily and 4 Hour Charts
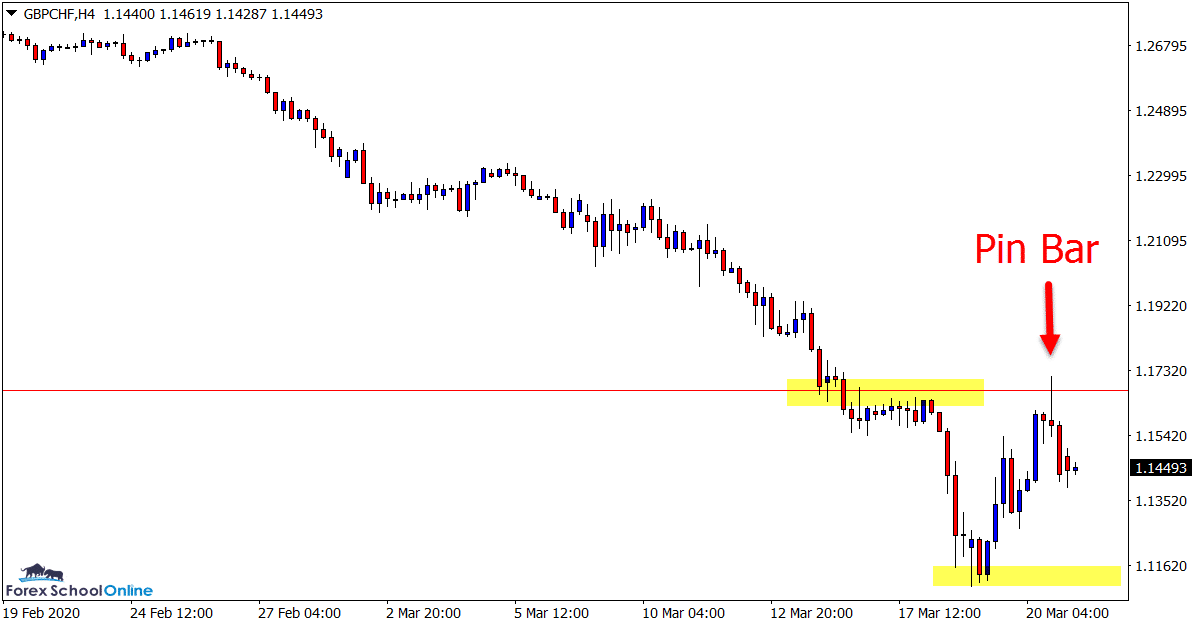
Bearish Pin Bar
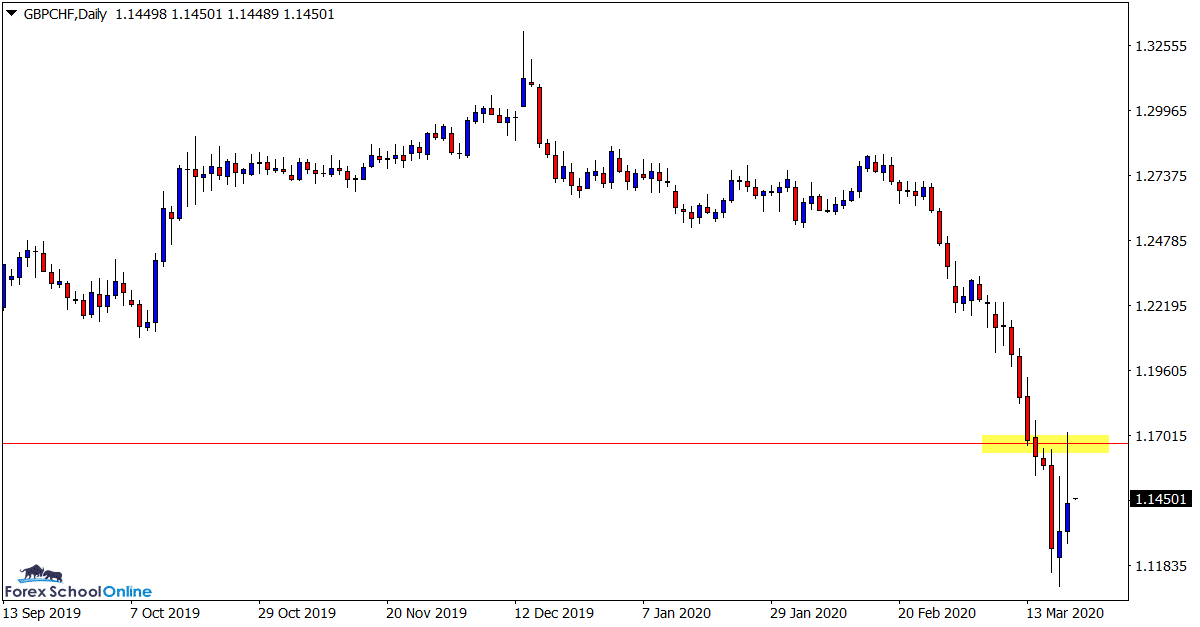
This is a very similar looking chart to the EURGBP, but inverse.
This market has been crunched of late with a small pullback higher last week.
As the 4 hour chart shows below; there is also a similar looking pin bar to what the EURGBP formed.
The start of the week looks to be crucial. If price continues the selling, it could look to fall directly back into the recent swing low before a potential new break lower.
Daily Chart
4 Hour Chart
GOLD Weekly and Daily Charts
Watching Overhead Resistance
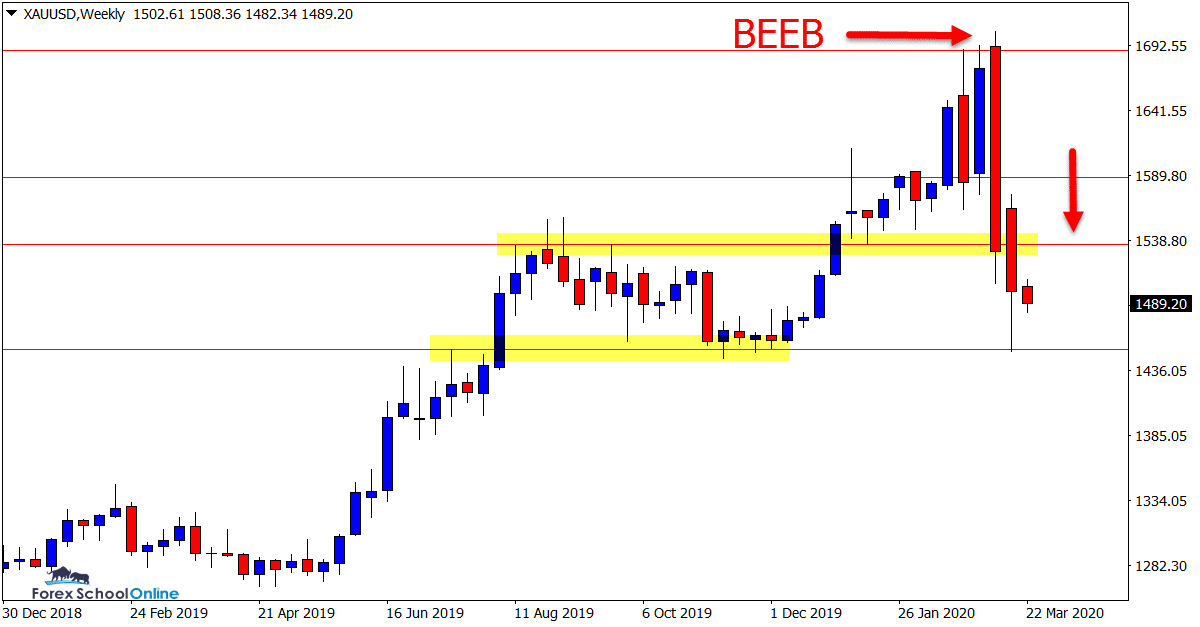
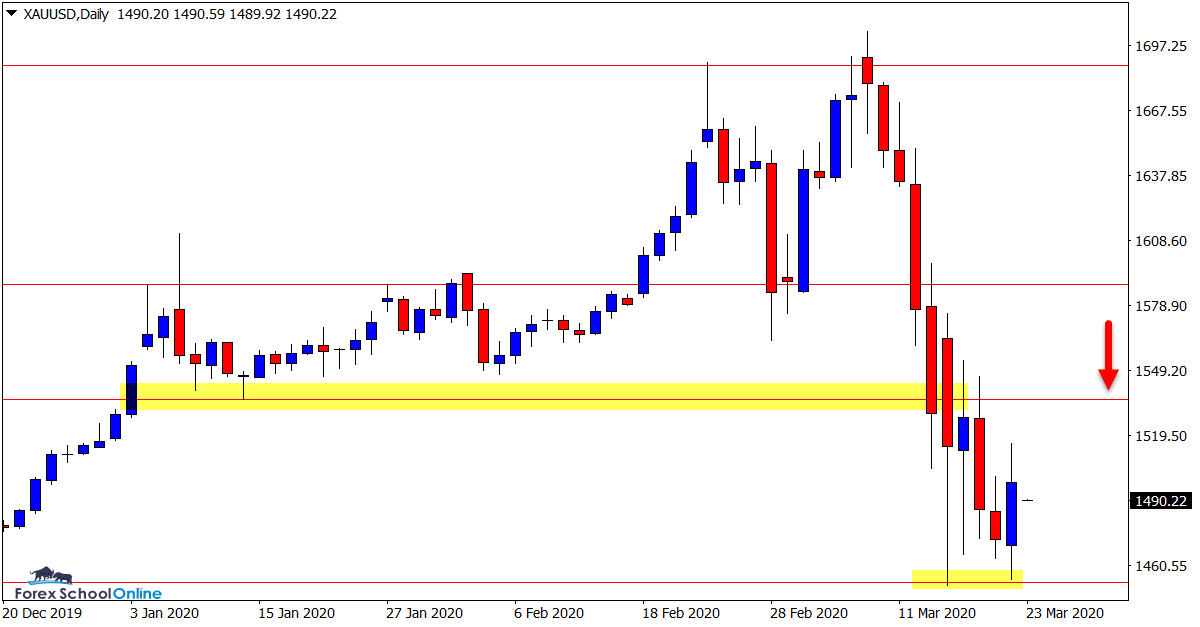
After a break lower from the Bearish Engulfing Bar discussed in last week’s trade ideas, price sold off into the next major support level.
This level has so far held up and price has since formed a bullish engulfing bar on the daily chart.
If price pops back higher it could see price move back into the overhead resistance.
This could be a solid level to watch in the coming sessions for potential short trade setups.
Weekly Chart
Daily Chart
Trade Ideas Note: All views, discussions and posts in the ‘charts in focus trade ideas’ are the view of Forex School Online and are not recommendations or trading advice. All posts are general in nature and are not advice to buy or sell.
Note: We Use Correct ‘New York Close 5 Day Charts’ – You can read about why we use these and how to download the correct free charts at Correct Free New York Close Demo Charts
Please leave questions or comments in the comments section below;


Leave a Reply