Weekly Price Action Trade Ideas – 21st to 25th Sep 2020
Markets Discussed in This Week’s Trade Ideas: Markets Discussed in This Week’s Trade Ideas: GBPJPY, US500, NZDCHF and EURSGD.
Note: We Use Correct ‘New York Close 5 Day Charts’ – You can read about why we use these and how to download the correct free charts at Correct Free New York Close Demo Charts
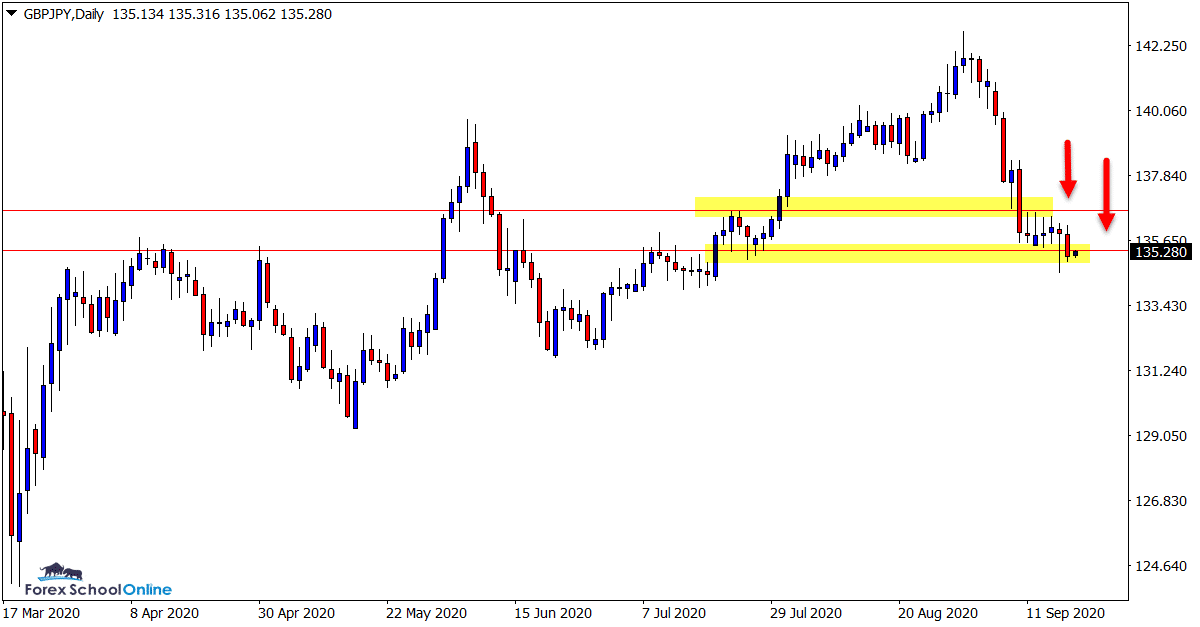
GBPJPY Daily Chart
-
Can Lower Prices Continue?
Price on the daily chart of the GBPJPY attempted to breakout of the four day sideways box pattern at the end of last week.
As the attached daily chart shows; price quickly snapped back higher and left the market in uncertain territory.
The candle low around 134.57 looks important with this market. This is the low of the candle that tried to breakout and snapped back higher.
If this breaks, then we could see much lower prices.
Daily Chart

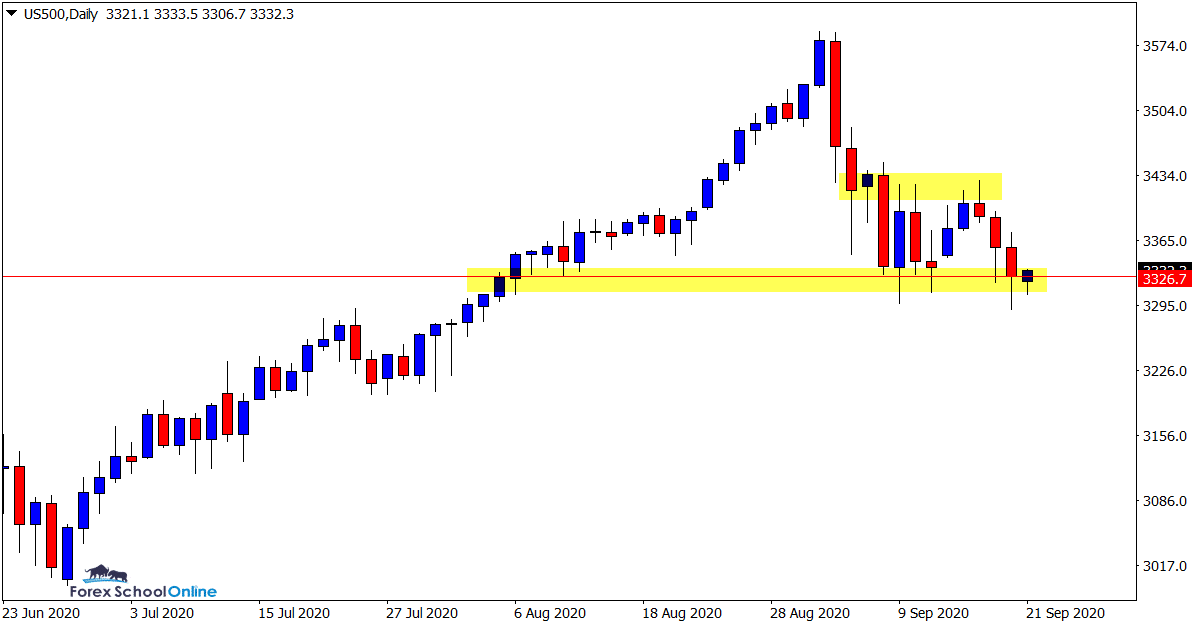
US500 Daily Chart
-
Support Looks Crucial
Whilst price has been booming higher in this market in recent months, we have seen a pretty solid pullback lower.
Price is currently holding at the daily support level.
This level looks crucial.
If we can get some bullish price action here it would signal more long trades and even further continuation of the trend higher.
Daily Chart

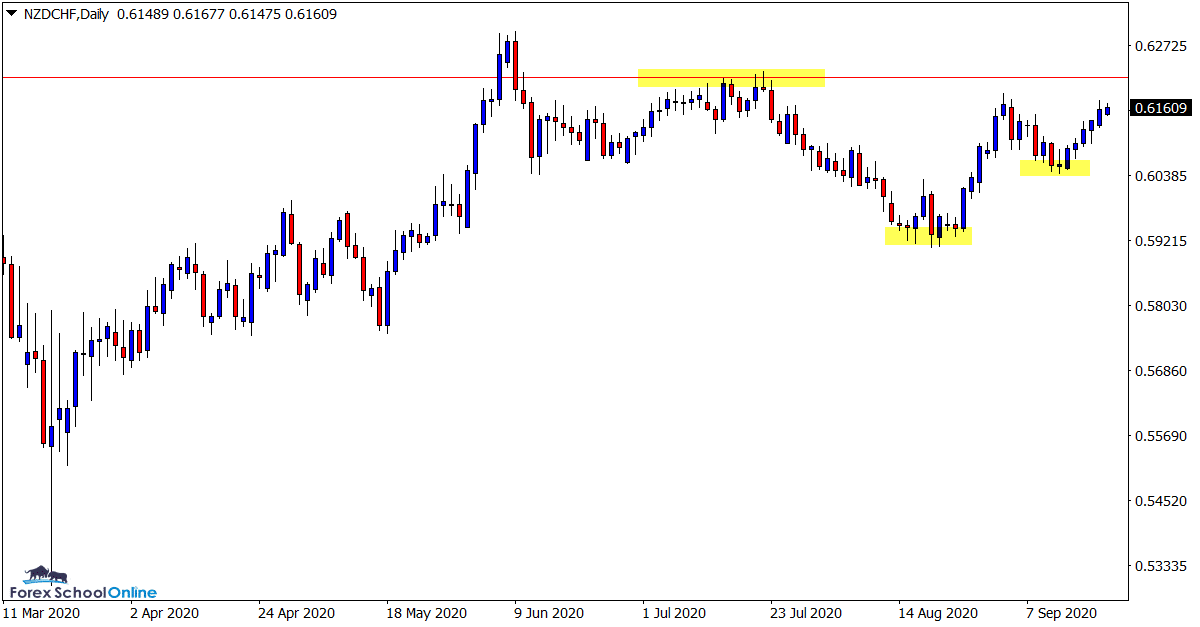
NZDCHF Daily Chart
-
Price Pushing Into Major Resistance
This is an interesting market to chart.
Price in recent times on the daily chart has formed a series of higher lows.
The interesting part however, is that when forming the recent swing high price could not make it all the way back to the major resistance.
This leaves price moving into a recent swing high and then for any major moves higher it will need to break what will be a very close major resistance again.
Daily Chart

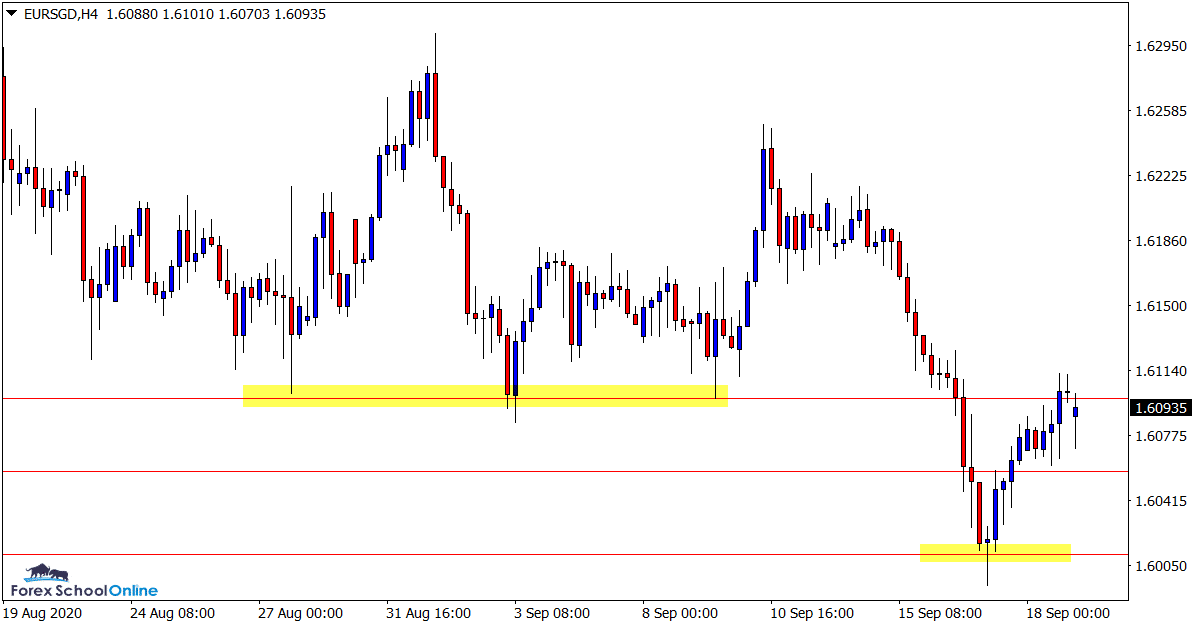
EURSGD 4 Hour Chart
-
Price Flip Level Now in Play
After finally making a breakout of the extended range area, price has rotated back into the old breakout support and price flip resistance.
Whilst we saw some minor selling on the intraday charts, so far we have not seen any sort of rejection of this level that some may have expected.
There has also been no bearish price action clues that price is looking to sell away from this level.
Obviously we will continue to watch the price action, but that is a concern for any traders looking to trade this market because if price pops back above this level, then we can expect a period of more sideways movement and ranging price action.
4 Hour Chart

Trade Ideas Note: All views, discussions and posts in the ‘charts in focus trade ideas’ are the view of Forex School Online and are not recommendations or trading advice. All posts are general in nature and are not advice to buy or sell.
Note: We Use Correct ‘New York Close 5 Day Charts’ – You can read about why we use these and how to download the correct free charts at Correct Free New York Close Demo Charts
Please leave questions or comments in the comments section below;


Leave a Reply