Weekly Price Action Trade Ideas – 20th to 24th May
Markets Discussed in This Week’s Trade Ideas: GBPCHF, AUDCAD, SILVER and AUS200.
Note: We Use Correct ‘New York Close 5 Day Charts’ – You can read about why we use these and how to download the correct free charts at Correct Free New York Close Demo Charts
AUDCAD Daily Chart
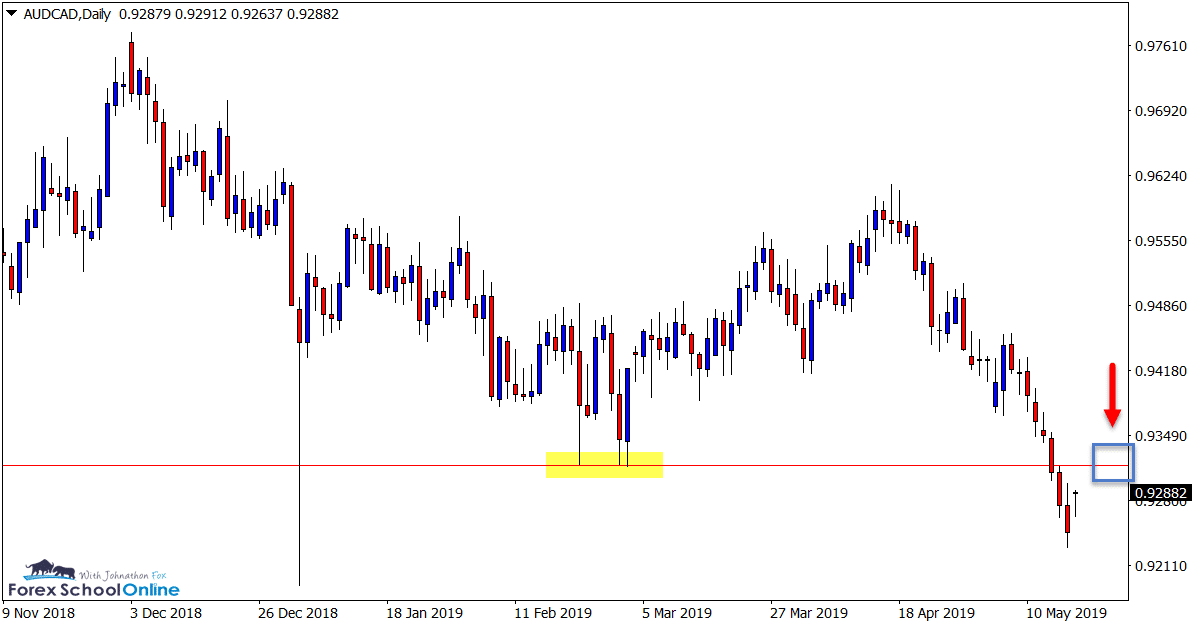
Retracing Into Major Daily Resistance
Last week price broke through a key daily support level making a strong close below.
We now see that this same level could look to hold as a new potential price flip old support and new resistance. It could also act as a solid spot to hunt reversal trades on higher time frames such as the daily and 4 hour charts to get short.
Any bearish high probability triggers at this level would be trading with the recent momentum and at a strong level.
Daily Chart
GBPCHF Daily Chart
Testing Long-term Daily Support
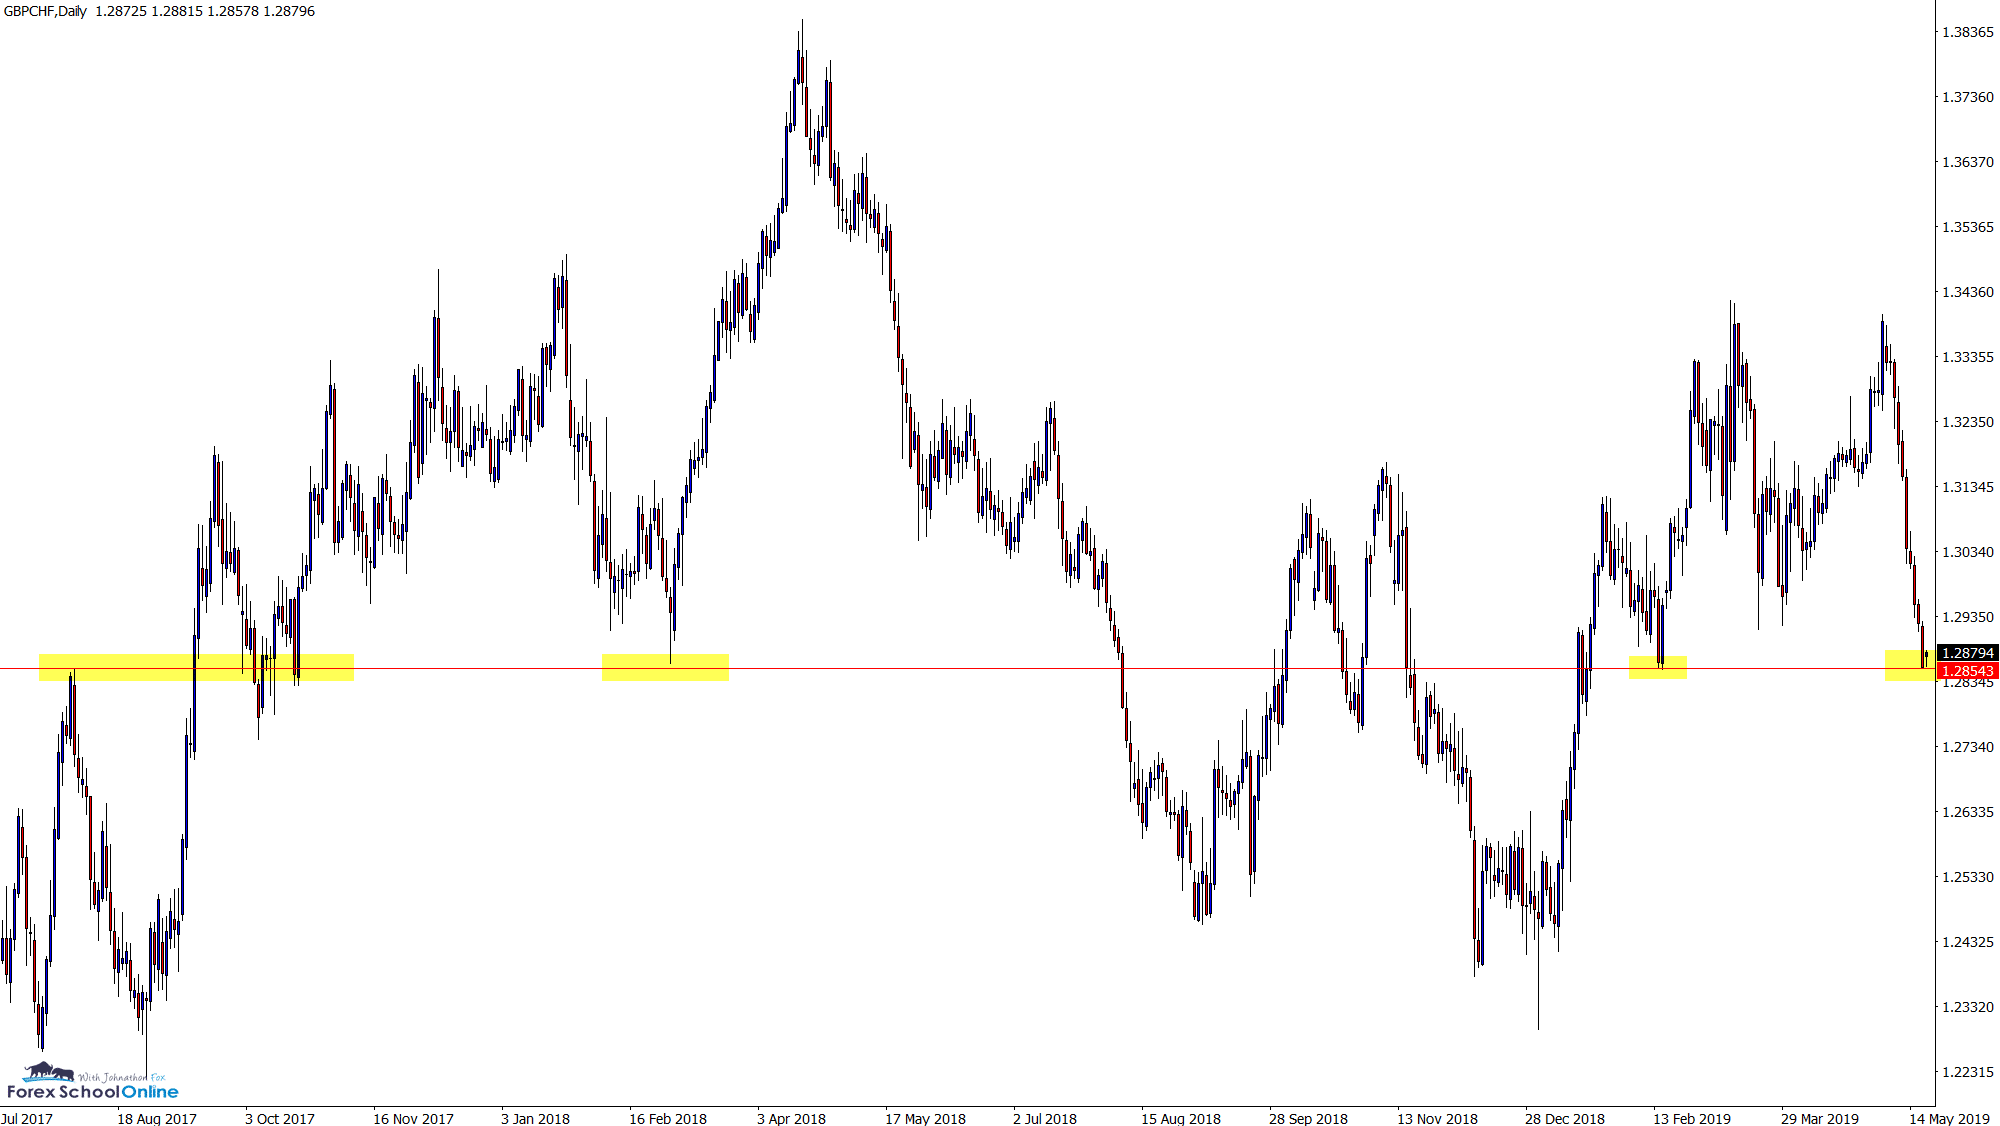
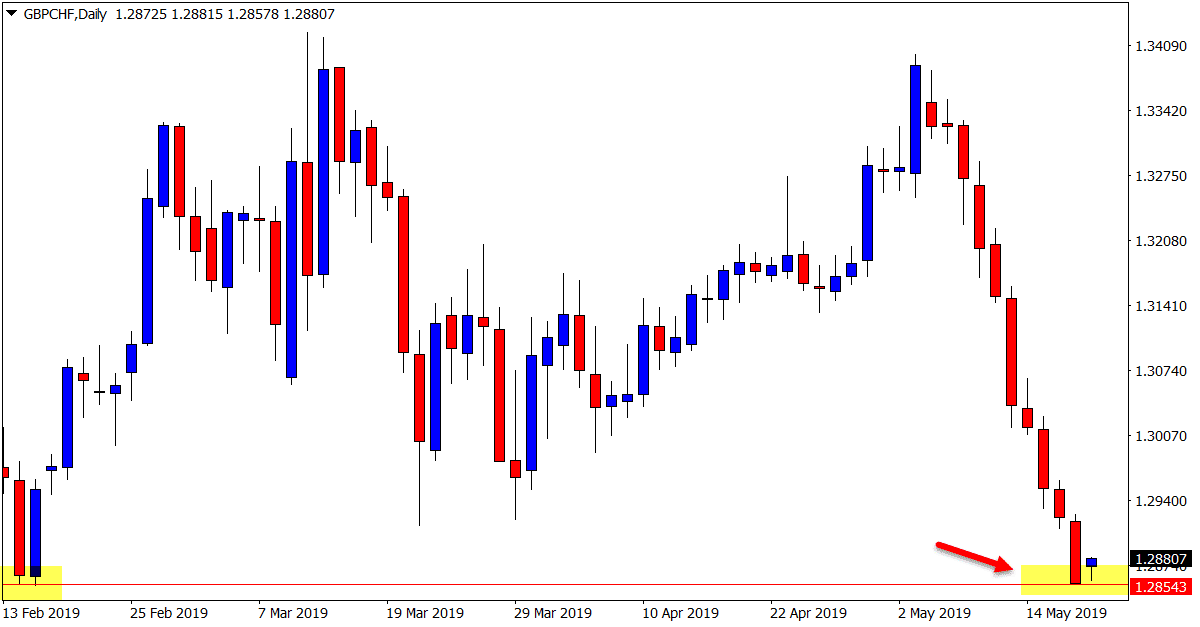
Price action on the daily chart of the GBPCHF is testing a multi-year support level.
As the zoomed out daily chart shows below; this level has held in the past as both a major resistance and support. After a huge move lower in recent weeks, price is now making a fresh test of this level.
After such an extended move lower, we would expect the market to take a breather and pause at some stage and this support could be the catalyst.
Whilst trading against such strong momentum is not recommended, this level does look to be important for this market and where price makes it’s next large push.
Daily Chart
Daily Chart
SILVER Daily and 4 Hour Charts
Pullback Into Value
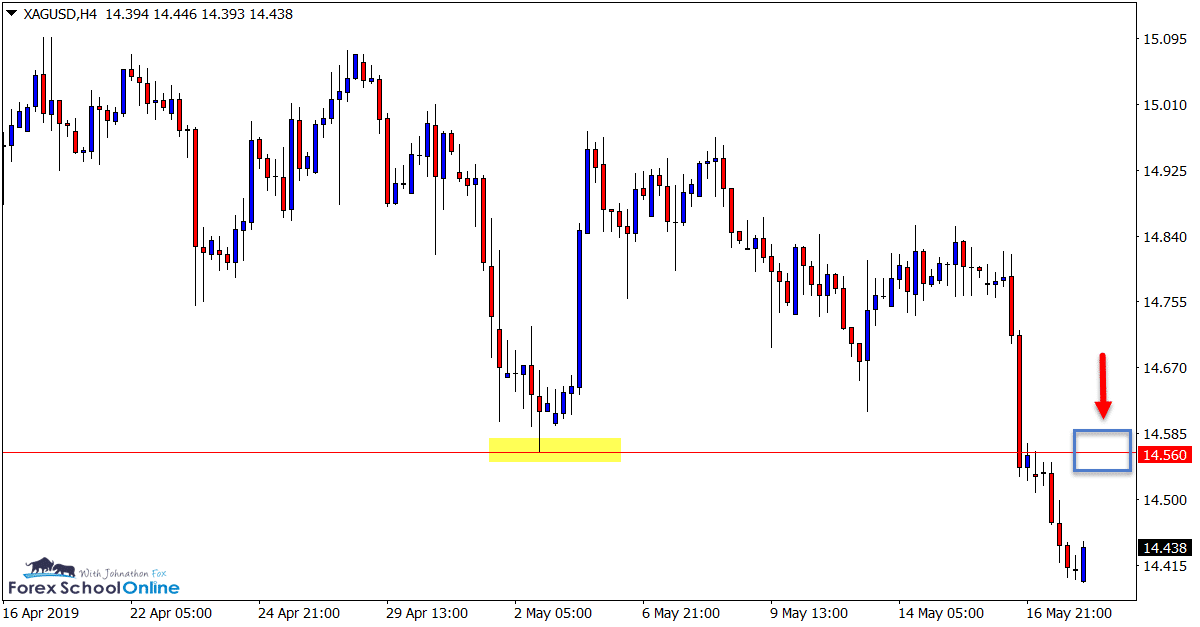
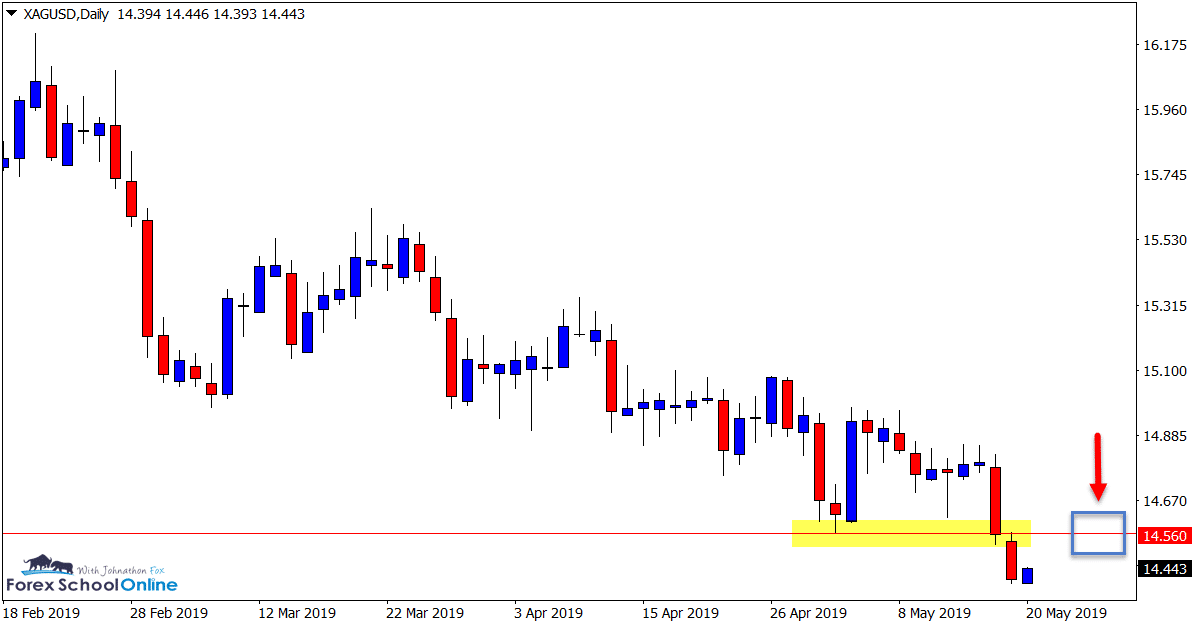
Price in this market in recent times has been creeping lower on the daily chart.
Before last week the moves had not been explosive, but price had been making regular lower highs.
Price has now aggressively broken below the key daily support and this level could prove crucial.
If price retraces back higher and into this level it could act as a high probability level to look for short trades and the next leg lower.
Daily Chart
4 Hour Chart
AUSSIE 200 Daily and 4 Hour Charts
Watching for Possible Price Flip / Test
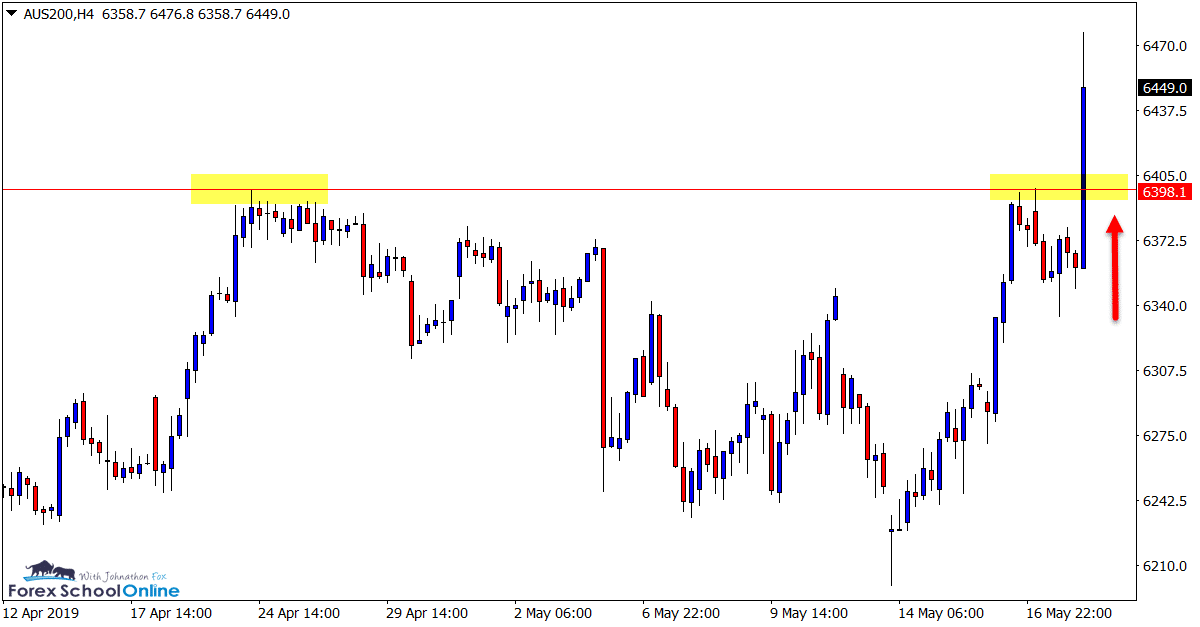
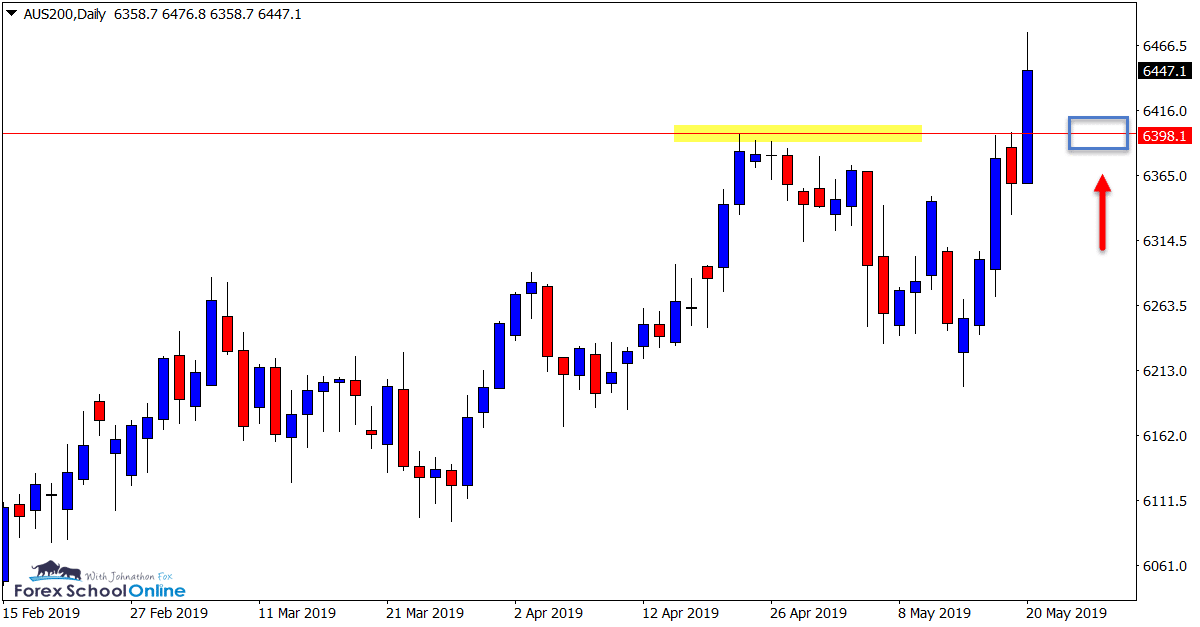
This market has exploded to breakout through the daily resistance and move into an 11 year high.
Looking to trade inline with this breakout and strong momentum looks the solid play whilst the old resistance and new price flip support holds.
Any weakness or retracements back into value or support could offer the chance to get into the next leg higher, keeping in mind we don’t want to enter at the top and buy expensive.
Daily Chart
4 Hour Chart
Charts in Focus Note: All views, discussions and posts in the ‘charts in focus’ are the view of Forex School Online and are not recommendations or trading advice. All posts are general in nature and are not advice to buy or sell.
Please leave questions or comments in the comments section below;


Hello MR FOX..thank you so much for sharing your knowledge I learnt a lot from the information that you keep sending my way,I have a question…let me put it this way..lets say i found support and resistance on the daily chart(like whats happening now with GBPCHF).Can i then go and place my trade on the lower time frame eg M30,and continue to monitor my trade on the daily time frame to check for any reversal signals against my position.Thanks in advance.
Hi Dakalo,
I discuss this more in-depth in the lesson here; https://www.forexschoolonline.com//manage-forex-trades-using-key-price-action-time-frames/
But if you still have questions let me know.
Johnathon