Weekly Price Action Trade Ideas – 20th to 24th July 2020
Markets Discussed in This Week’s Trade Ideas: USDCHF, EURAUD, AUDCAD and GOLD.
Note: We Use Correct ‘New York Close 5 Day Charts’ – You can read about why we use these and how to download the correct free charts at Correct Free New York Close Demo Charts
USDCHF Daily Chart
Support Looks Key
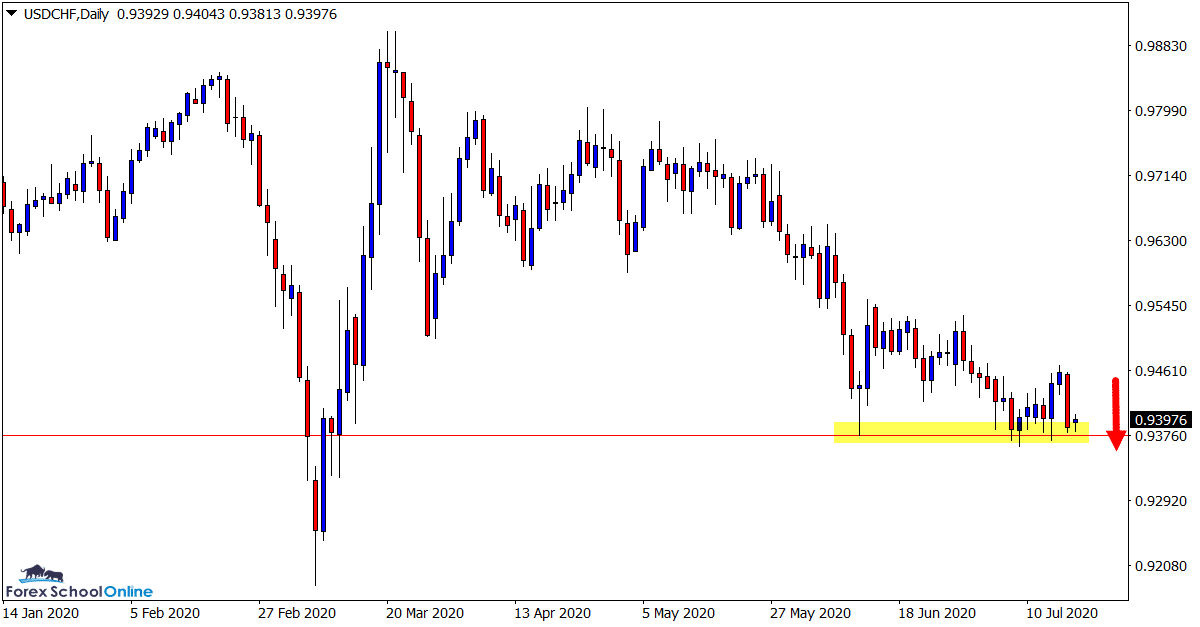
In recent times in this market price has been making a series of lower highs on the daily chart.
Whilst the short-term momentum is lower, price has been running into the daily chart support and as yet has not been able to break it.
This level looks crucial for where price makes its next solid move.
If we can get a clear break lower below this level with the recent momentum in the next few sessions it could pave the way for a new leg lower. It could also open the way for potential short trades.
Daily Chart

EURAUD Daily Chart
Waiting on a Breakout
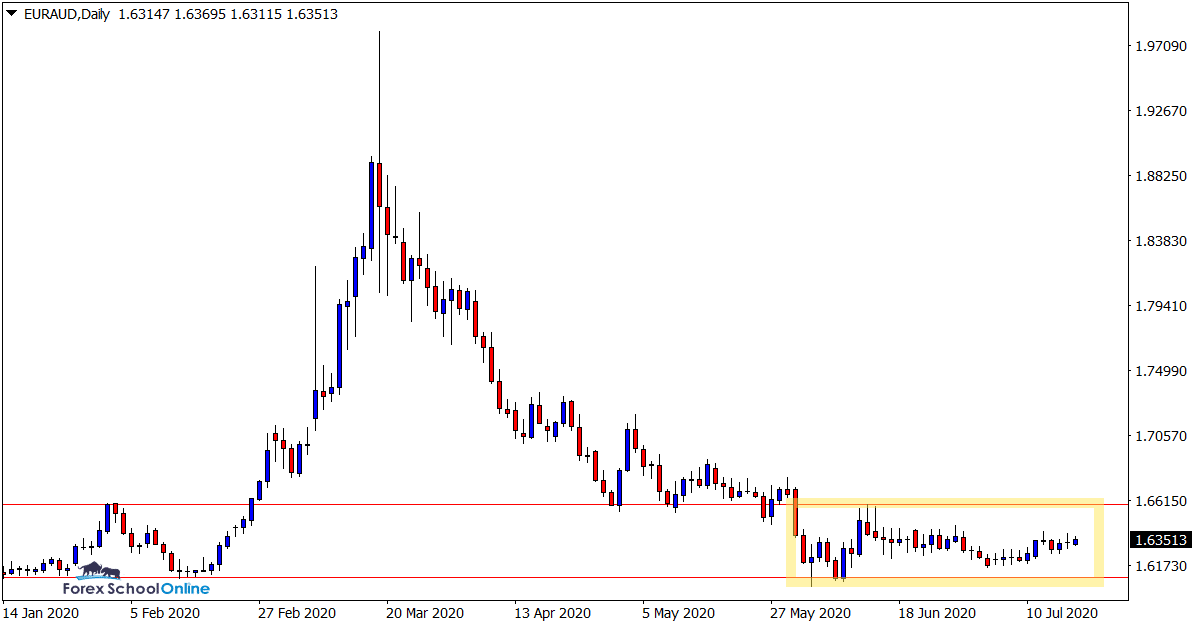
A lot of Forex pairs have been frustrating to chart in recent weeks.
After the extreme volatility and plethora of trading opportunities that were around at the start of the year, we are now faced with markets that are grinding and not doing much at all.
This pair is a prime example of that sort of price action.
When price finally breaks out it could be explosive, but whilst it grinds in between the range support and resistance levels there are not a lot of trades to be found.
Daily Chart

AUDCAD Daily Chart
Bullish Whilst Trend and Support Hold
We discussed this market in last week’s trade ideas.
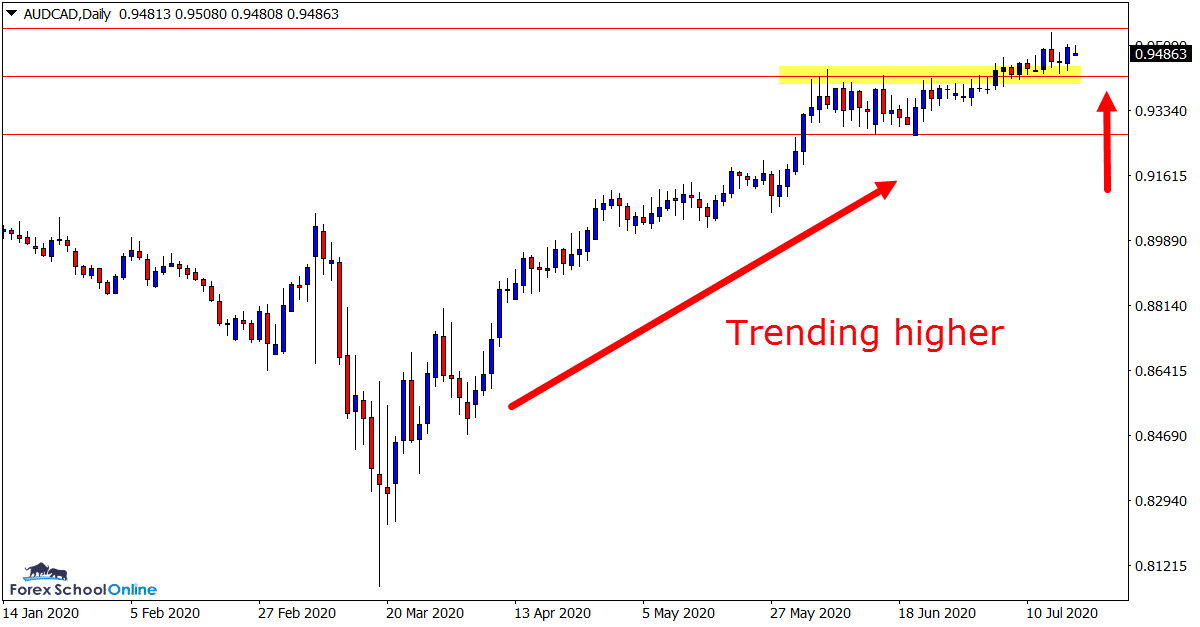
The old breakout level has since held as a new support price flip level and price has made a leg higher.
The trend in this market is clearly to the upside and whilst the near term support and trend higher continues to hold, looking for potential bullish long trades looks the best play.
Daily Chart

GOLD Daily Chart
Still Bullish Whilst Support Holds
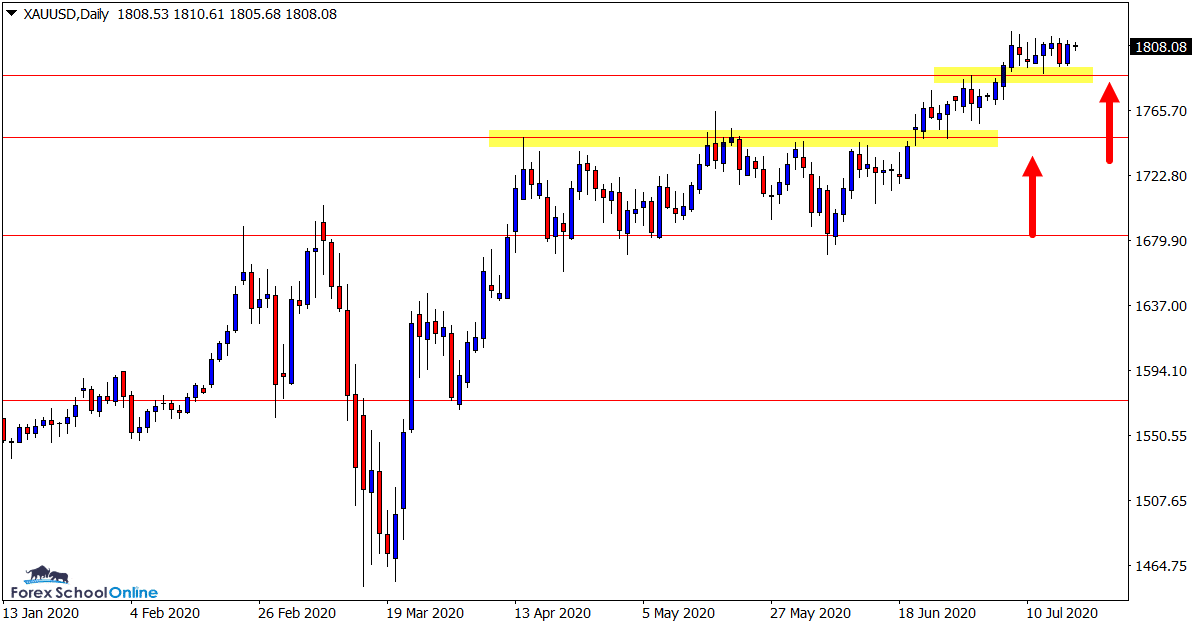
After price made a break higher and through the multi-year resistance level price action on the daily chart of Gold has stalled.
As the chart below shows; price has formed multiple inside bars and has not been able to break the high of the daily candle from 8 sessions ago.
This market looks bullish whilst the support continues to hold, but the near term support does look important.
If this support level can hold for a major push through the consolidation resistance zone, then we could see a much larger leg higher and further bullish trading opportunities.
Daily Chart

Trade Ideas Note: All views, discussions and posts in the ‘charts in focus trade ideas’ are the view of Forex School Online and are not recommendations or trading advice. All posts are general in nature and are not advice to buy or sell.
Note: We Use Correct ‘New York Close 5 Day Charts’ – You can read about why we use these and how to download the correct free charts at Correct Free New York Close Demo Charts
Please leave questions or comments in the comments section below;


Leave a Reply