Weekly Price Action Trade Ideas – 20th to 24th April 2020
Markets Discussed in This Week’s Trade Ideas: EURUSD, GOLD, GBPCHF and AUDUSD.
Note: We Use Correct ‘New York Close 5 Day Charts’ – You can read about why we use these and how to download the correct free charts at Correct Free New York Close Demo Charts
EURUSD Daily Chart
Many Opportunities Could Present
After so many large moves in many of the major Forex pairs recently, price has stabilized over the previous sessions.
The EURUSD is a good example of this.
After huge spikes both higher and lower, price has calmed down and moved into far smaller daily price range movements.
Price on the daily chart is stuck between a daily support and resistance level that both could provide potential trade setups.
Range traders could look to play both sides of the market when these levels are tested with price action triggers. Breakout traders could look for potential intraday breakout trades.
Daily Chart
GOLD Weekly and Daily Chart
Weekly False Break Pin Bar
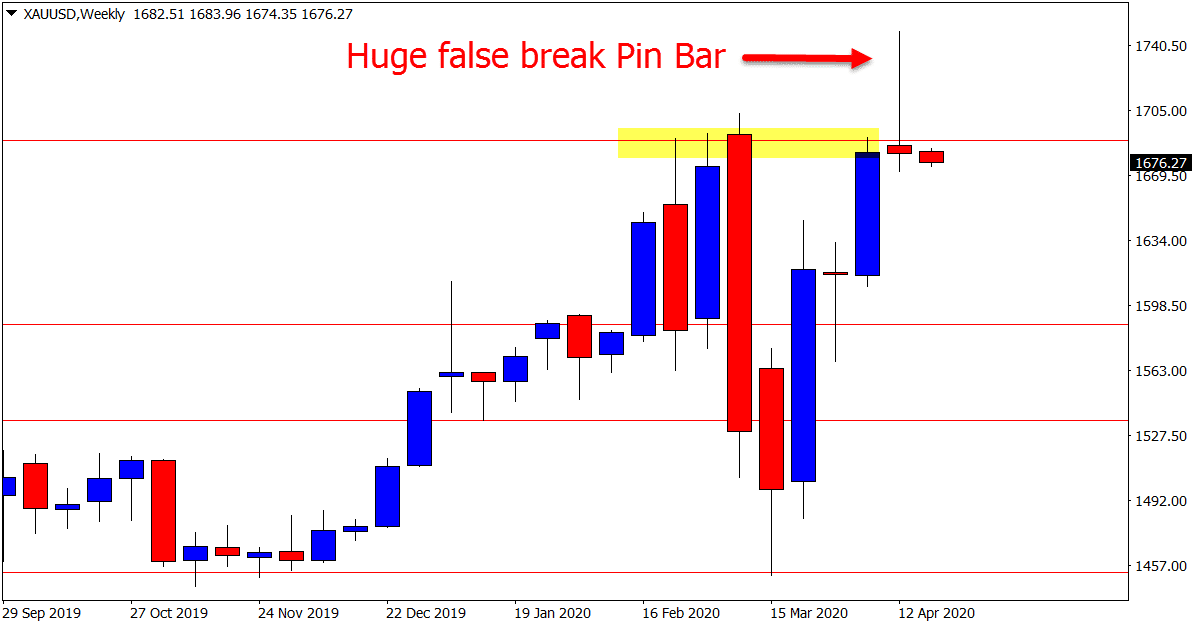
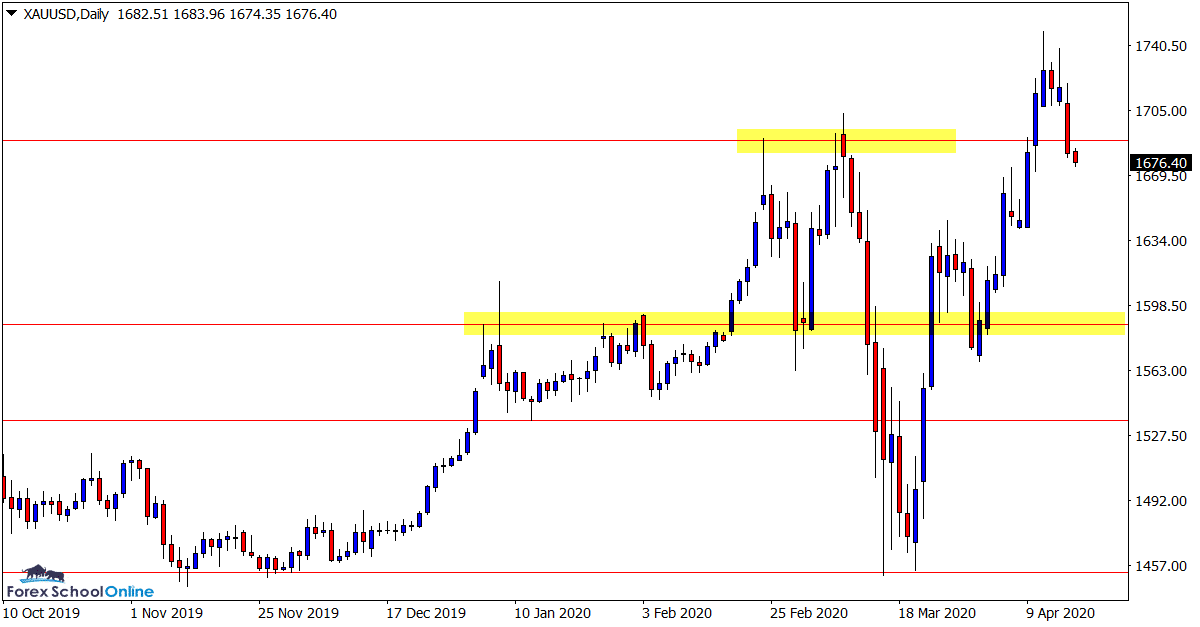
In last week’s trade ideas we were watching to see if this market would break out of the major resistance higher.
After making a solid break and popping higher, price quickly reversed and by the end of the week closed below the important resistance level.
This is best shown on the weekly chart below. Price has formed a huge false break pin bar.
Aggressive traders could be watching this pin bar for confirmation over the next few sessions. For traders looking to get with the momentum and recent trend higher, this pin could move price back into a support area and a potential area to hunt long trades.
Weekly Chart
Daily Chart
GBPCHF Daily Chart
Price is Crawling
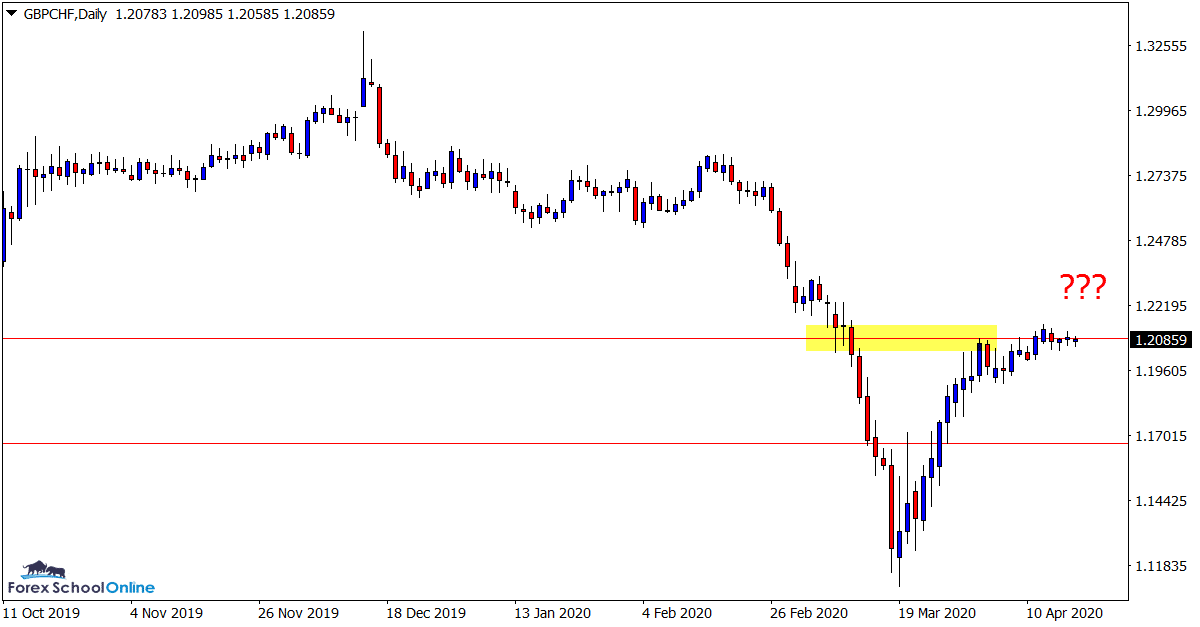
Last week we were watching this market and the daily chart resistance price was hovering around.
In the last week’s trading price has not traveled anywhere.
Whilst we have not seen a breakout higher, we have also not seen a rejection and move back lower.
This level still looks to be important until we can get a clear move either way. A break higher and this standstill could quickly be snapped.
Daily Chart
AUDUSD Daily and 4 Hour Charts
No Follow Through
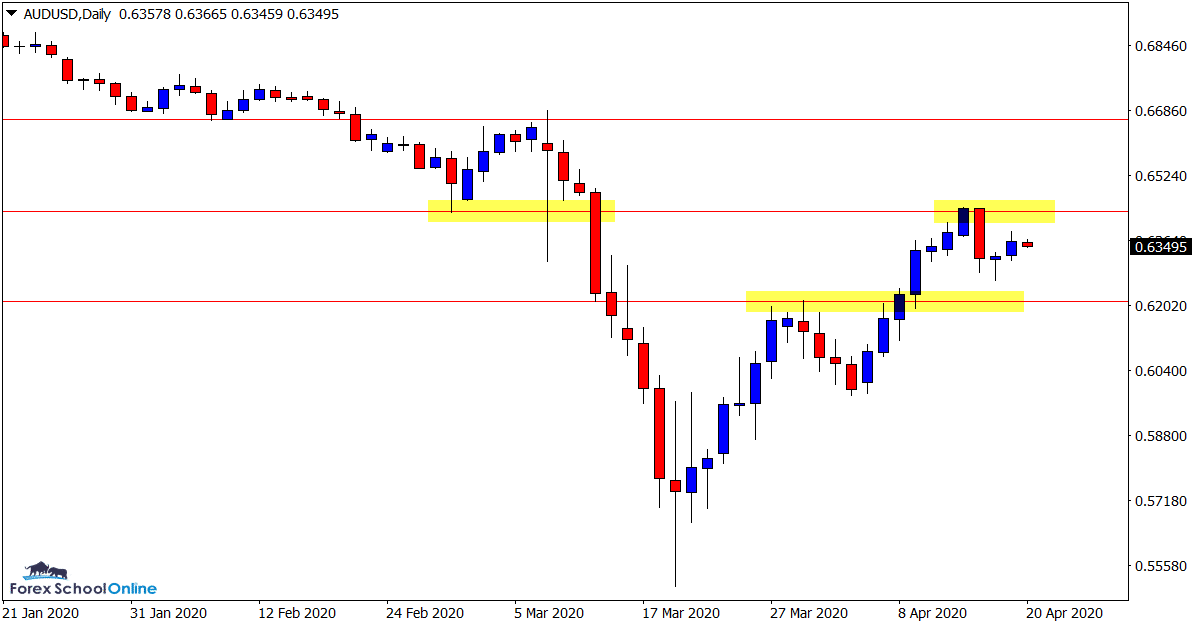
Whilst price did move higher and into the resistance and 61.8% Fibo level we recently discussed, the sell-off was weak with little follow through.
If we look at the intraday 4 hour chart we can see that price has been trading sideways with a lot of inside bars.
We can also see price looks to be between two levels.
Until either of these levels are tested with clear price action or a solid break occurs, it could be best to watch for clearer price action.
Daily Chart

4 Hour Chart
Trade Ideas Note: All views, discussions and posts in the ‘charts in focus trade ideas’ are the view of Forex School Online and are not recommendations or trading advice. All posts are general in nature and are not advice to buy or sell.
Note: We Use Correct ‘New York Close 5 Day Charts’ – You can read about why we use these and how to download the correct free charts at Correct Free New York Close Demo Charts
Please leave questions or comments in the comments section below;


Leave a Reply