Weekly Price Action Trade Ideas – 19th to 23rd of August
Markets Discussed in This Week’s Trade Ideas: NZDUSD, AUDJPY, EURCAD and US30.
Note: We Use Correct ‘New York Close 5 Day Charts’ – You can read about why we use these and how to download the correct free charts at Correct Free New York Close Demo Charts
AUDJPY Daily and 1 Hour Charts
Daily Chart Inside Bars Winding up
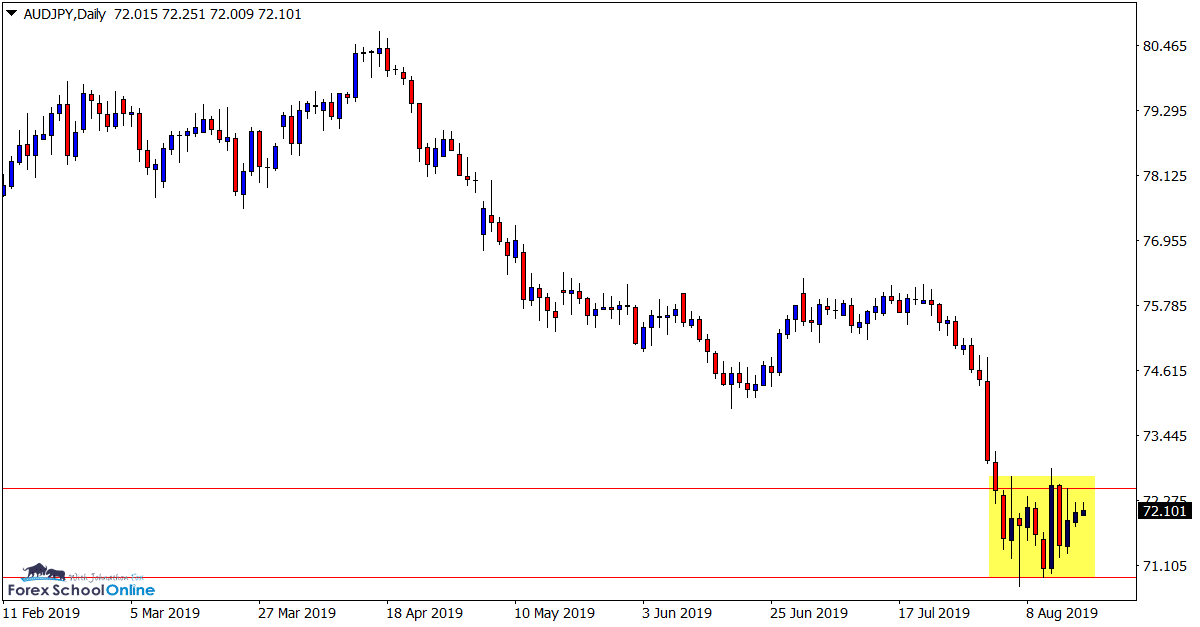
Price action on the daily chart of the AUDJPY has formed three consecutive inside bars winding up tighter and tighter.
As the daily chart shows below; price has recently sold off heavily after breaking out of the sideways consolidation pattern it was trading in.
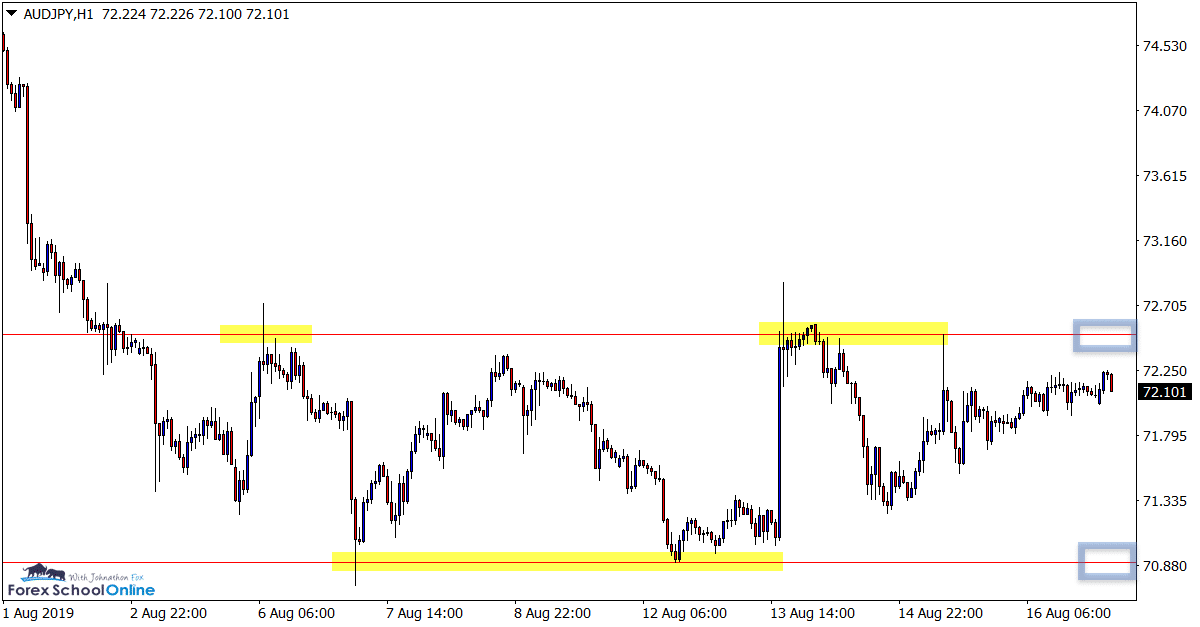
The high and low of this tight box and wind up could now be watched on the intraday charts such as the 1 hour chart for possible price action clues.
Daily Chart
1 Hour Chart
NZDUSD Daily Chart
Price Slides Lower
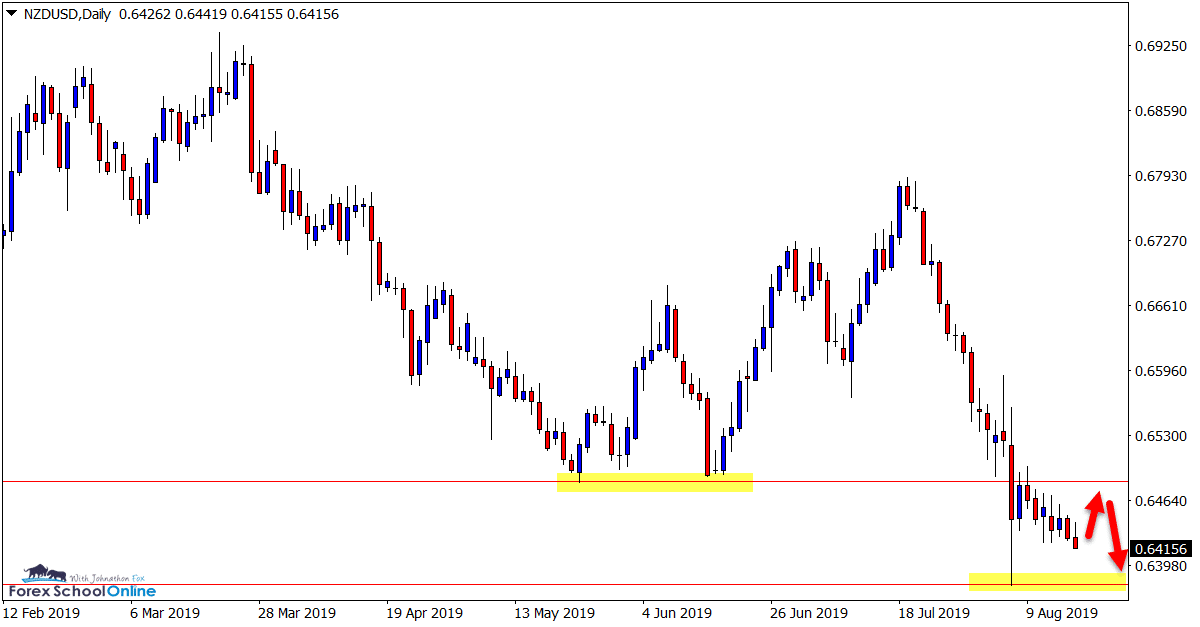
After attempting to form a trend higher on the daily chart, price has sold off and crashed through the key support level.
Price is now just grinding lower without forming any candles of substance. The daily support and resistance looks to be key for where price moves next.
If price rotates higher and makes a strong rejection, then we could see another leg lower and a possible breakout through support.
Daily Chart
EURCAD Daily Chart
Price Breaks Flip Level
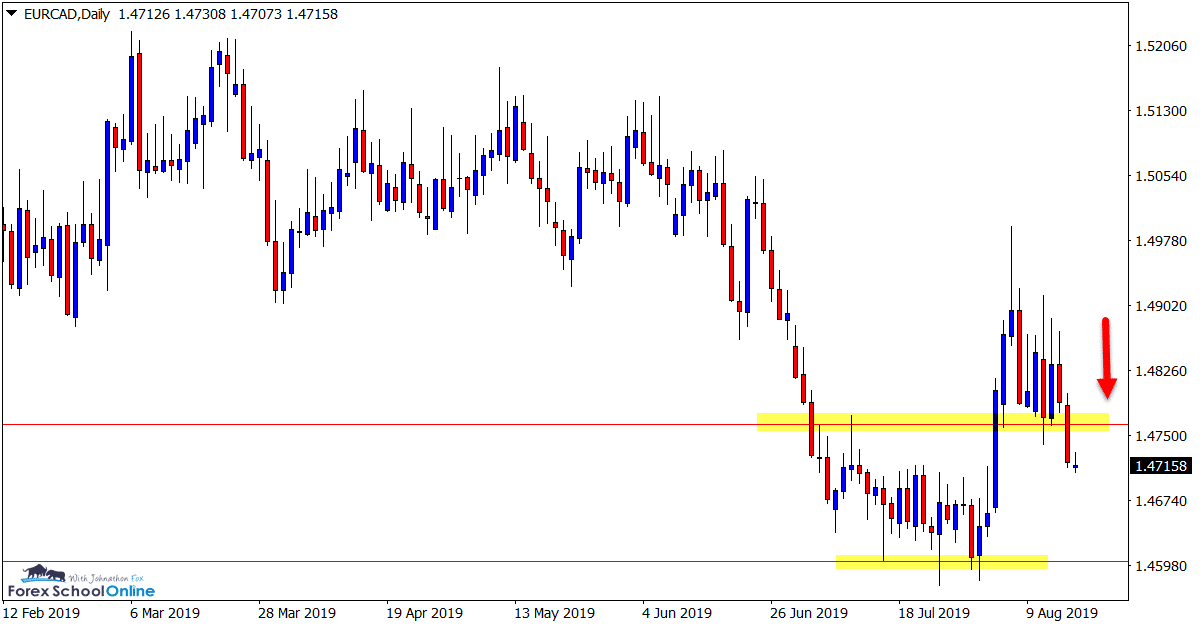
This is a bit of a strange looking price action chart. We can see in recent times price had been stuck in a long term range before breaking lower. This breakout lower was short-lived and price moved right back into the range.
Now price is looking to once again bust below the range level support and potentially make a decent move lower.
The level price is looking to breakout lower through could act as a price flip level and an old support / new resistance for possible short trades. Bearish price action clues could be watched for on the smaller intraday time frames.
Daily Chart
US30 Daily Chart
Major Resistance Could be Crucial
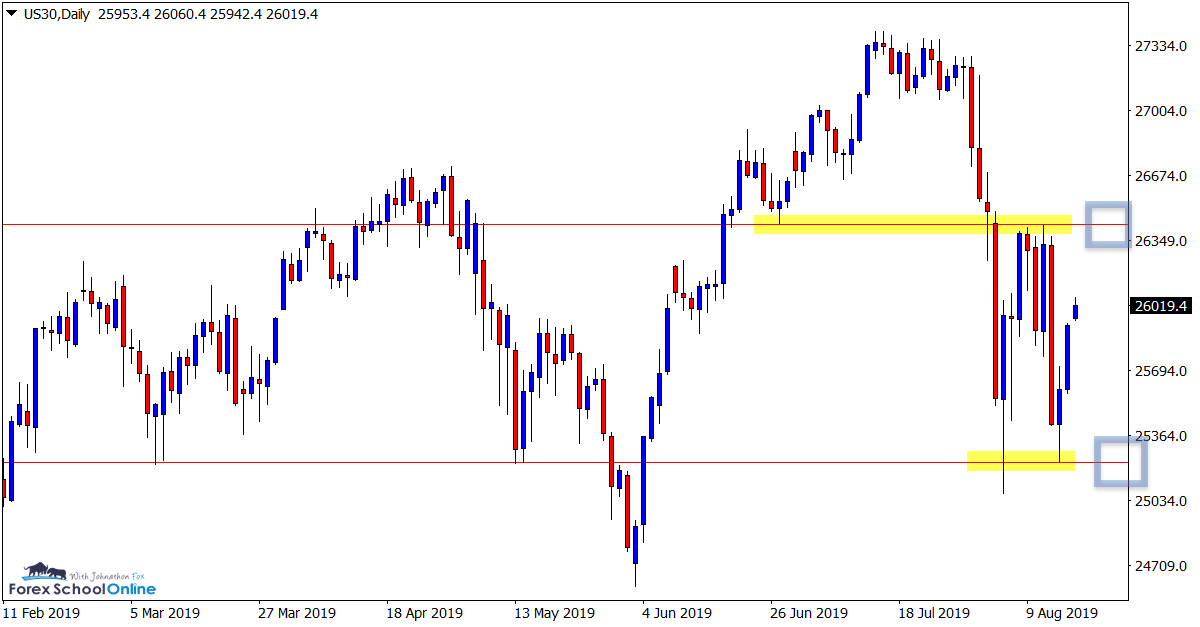
It has been an interesting past week on the international stock markets with some aggressive selling, followed by price pegging back some losses.
On the US30 we can see this occurred over the previous week with a large daily sell off followed by prices bouncing back higher.
As the daily chart shows below; price is now tracking higher and possibly into the overhead key resistance level. This is the same level that price made it’s last aggressive move lower from.
This level looks to be crucial and a major watch over the coming sessions.
Daily Chart
Trade Ideas Note: All views, discussions and posts in the ‘charts in focus’ are the view of Forex School Online and are not recommendations or trading advice. All posts are general in nature and are not advice to buy or sell.
Please leave questions or comments in the comments section below;


Leave a Reply