Weekly Price Action Trade Ideas – 19th to 23rd Oct 2020
Markets Discussed in This Week’s Trade Ideas: AUDJPY, USDCAD, NZDUSD and GBPAUD.
Note: We Use Correct ‘New York Close 5 Day Charts’ – You can read about why we use these and how to download the correct free charts at Correct Free New York Close Demo Charts
AUDJPY Daily Chart
-
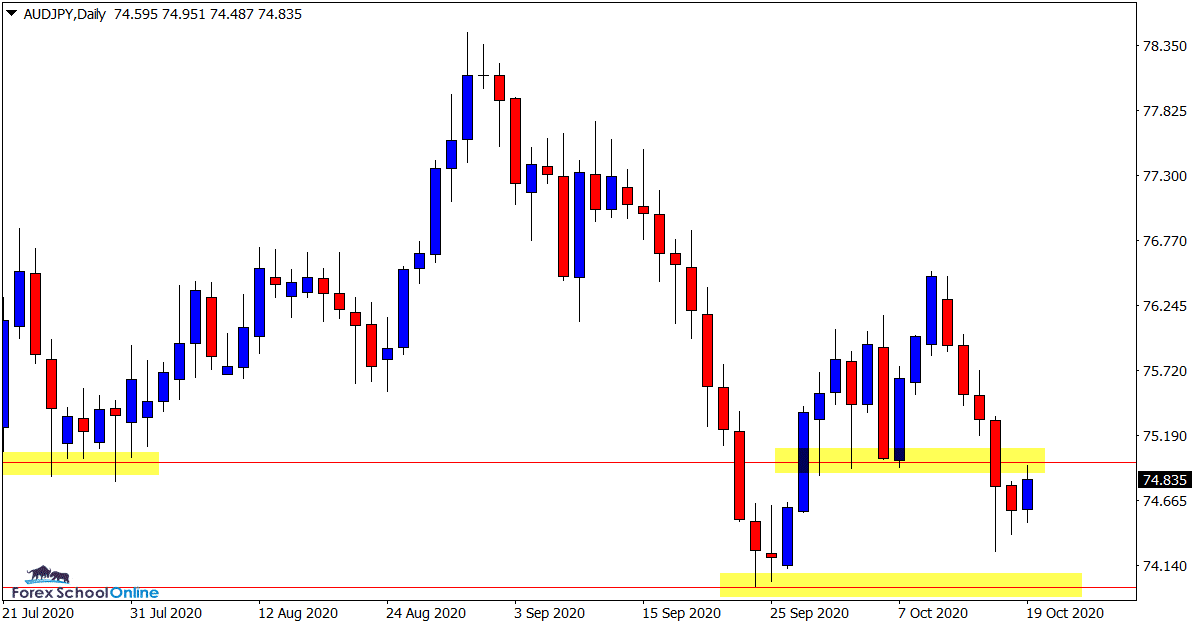
Now Testing Daily Price Flip Level
Price on the daily chart of the AUDJPY is now re-testing the recent swing support level.
This level is looking to try and hold as a new price flip support and resistance level.
In the medium term on the daily chart we can see the beginnings of a 1,2,3 trend reversal pattern. Price is now attempting to form the last leg lower.
If price can now break lower and form a new lower low we would have a new trend reversal with all the momentum lower.
This could then open up short trading opportunities.
Daily Chart

USDCAD Daily Chart
-
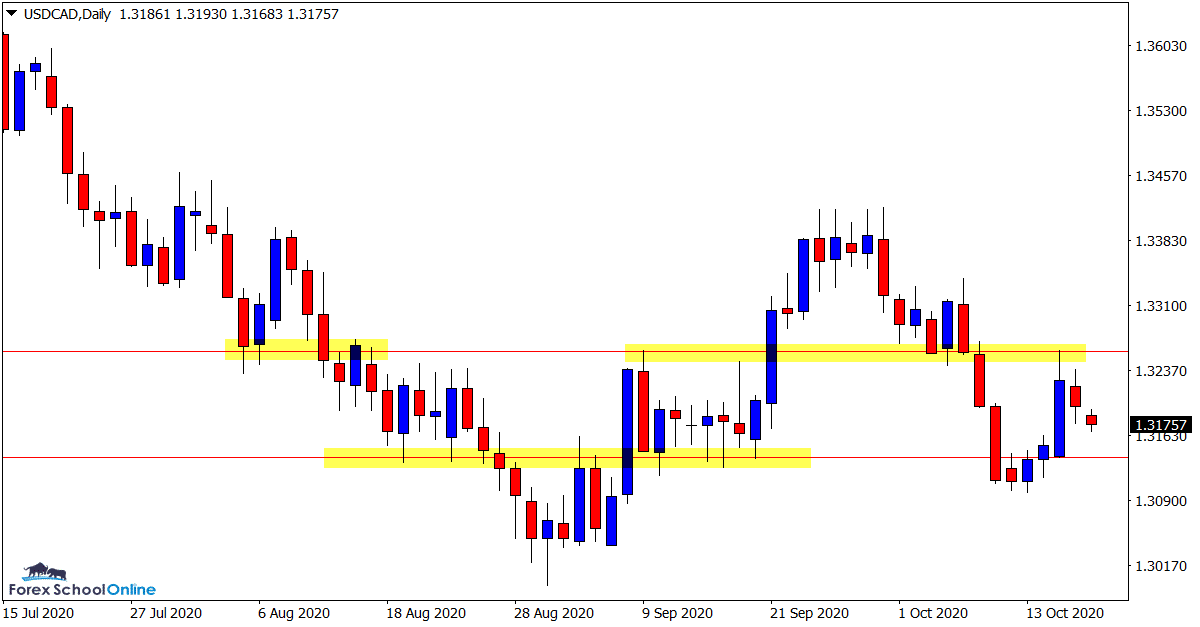
Price is Now Back in Range
Price is now stuck in a sideways move on the daily chart of this pair.
As the attached daily chart shows; whilst price has been in an overall down-trend, in recent times price has been stuck in a range.
Price is now looking to sell back lower and into the recent support level.
Until we get a clean break either higher or lower, we can look to play both sides of the range on both the daily and intraday charts from the major support and resistance levels.
Daily Chart

NZDUSD Daily Chart
-
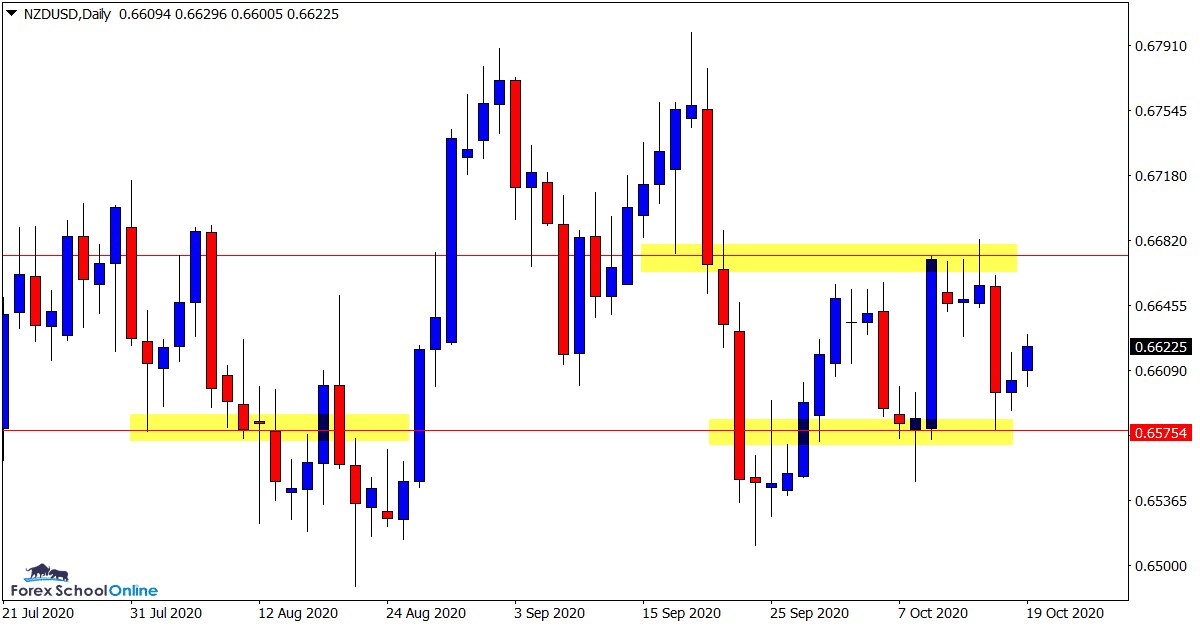
Big Test of Resistance Coming
A big test for how strong the bulls are in this market is coming up on the daily chart of this pair.
As the attached daily chart shows; price recently attempted a move higher before it was heavily sold back lower.
This same resistance level presents a major test for any bullish momentum.
Whilst price has been making some solid swings both higher and lower, price has not made a substantial trend in either direction for months. Price is now trading at the exact same point that it was back at the end of July.
We can expect this sideways movement to continue in the short-term and to offer trades from both the major support and resistance levels.
Daily Chart

GBPAUD Daily Chart
-
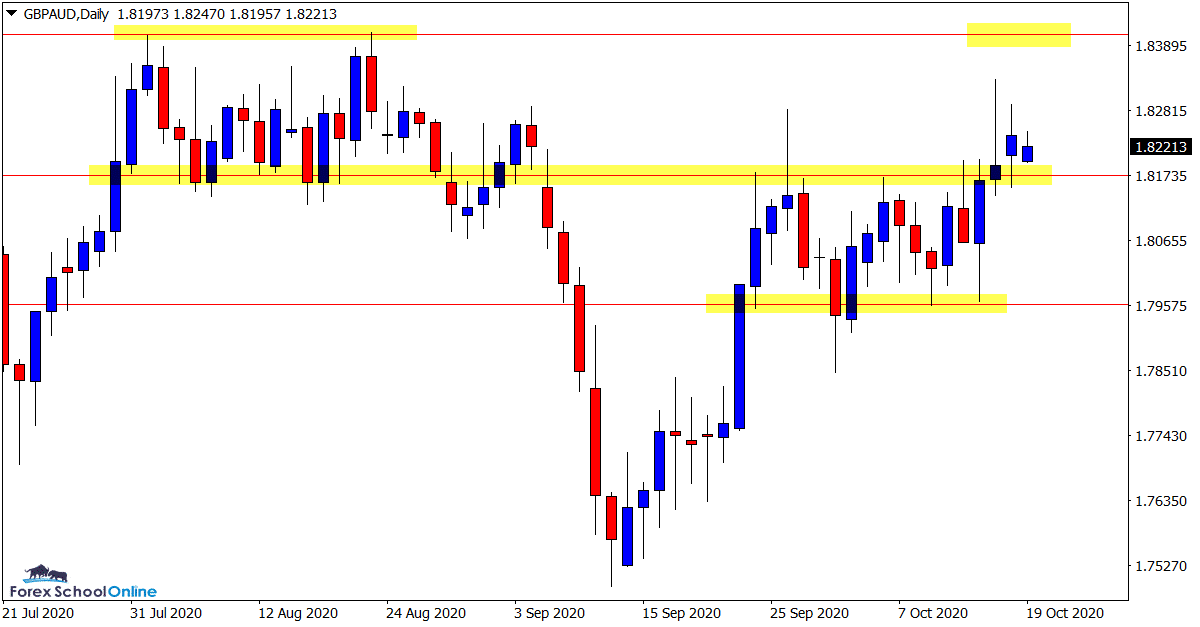
Price Looking to Push Higher
We discussed this pair at the end of last week and the bullish momentum price had been building.
Price has now broken above the price flip support level and is looking like it could move into the major resistance level.
This resistance level could provide a chance to look for short trades on both the daily and intraday charts.
We could look for high probability bearish price action reversal signals at this level to confirm any potential short trades.
Daily Chart

Trade Ideas Note: All views, discussions and posts in the ‘charts in focus trade ideas’ are the view of Forex School Online and are not recommendations or trading advice. All posts are general in nature and are not advice to buy or sell.
Note: We Use Correct ‘New York Close 5 Day Charts’ – You can read about why we use these and how to download the correct free charts at Correct Free New York Close Demo Charts
Please leave questions or comments in the comments section below;


Leave a Reply