Weekly Price Action Trade Ideas – 18th to 22nd Nov 2019
Markets Discussed in This Week’s Trade Ideas: AUDUSD, NZDUSD, GBPJPY and NZDJPY.
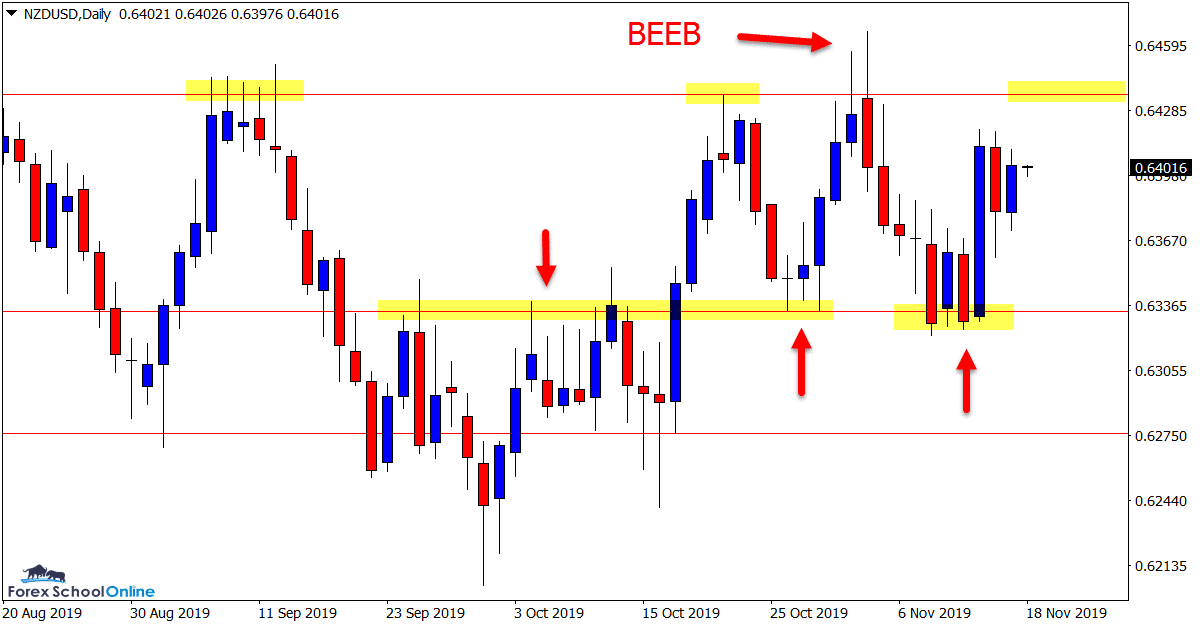
NZDUSD Daily Chart
Support Level Holds
Whilst this market is in a sideways pattern, the levels are fairly clear and price action has been respecting them in recent times.
As we discussed in last week’s trade ideas, price formed a bearish engulfing bar on the daily chart that saw price sell off lower into the next support level.
This level has so far held and price has now formed an inside bar on the daily chart.
The above resistance where the engulfing bar recently formed looks crucial for this market should price make a test in the next few sessions.
Daily Chart
AUDUSD Daily and 4 Hour Charts
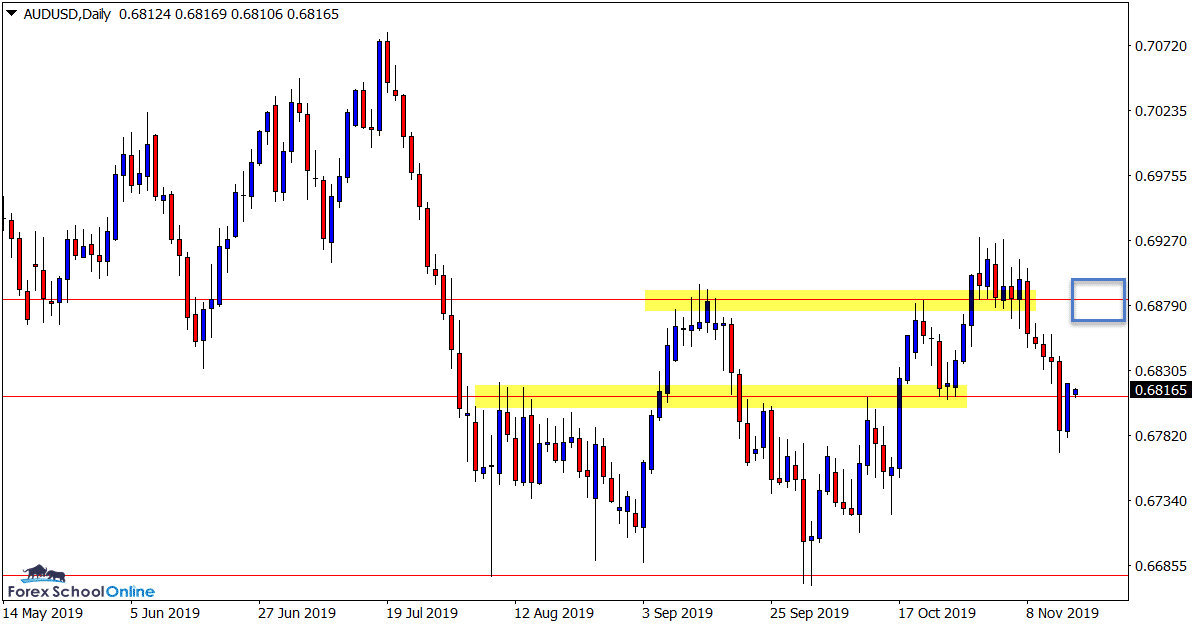
Daily Chart Inside Bar at Price Flip
At the moment we are seeing a lot of Forex pairs that are either in super tight box consolidation patterns or sideways ranges.
This indecision and sideways movement is causing a lot of price movement that does not create a lot of follow through or free flowing moves.
The AUDUSD is a good example of this lack of follow through and sideways movement.
Whilst two weeks ago price looked like it could be heading for a breakout through the resistance and a potential move higher, it quickly slid back lower.
During last week’s trading we saw price break lower below the daily support level, but when testing as a new resistance it rotated back above (see 4 hour chart below).
These current market conditions and how each pair is moving are incredibly important to factor in at the moment.
Daily Chart
4 hour Chart

GBPJPY Daily and 4 Hour Charts
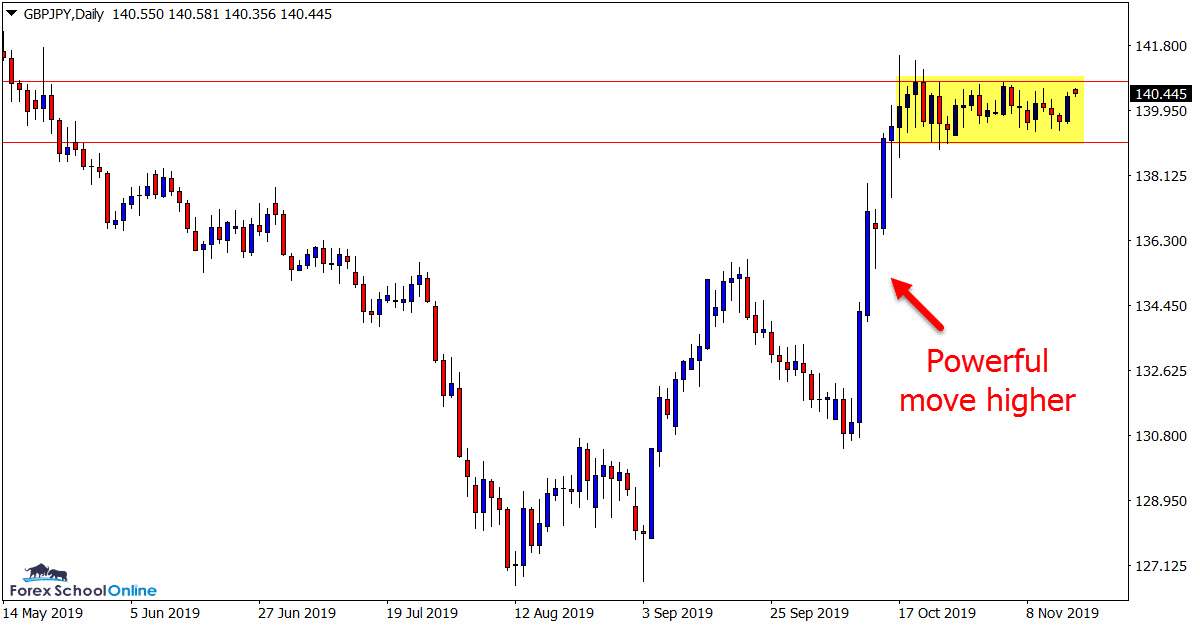
Price Action Has Stalled
As discussed with the AUDUSD above a lot of pairs are either stuck in very tight box patterns or are trading sideways and not doing a whole heap.
The GBPJPY is one of these pairs with price consolidating and moving sideways after a strong move higher.
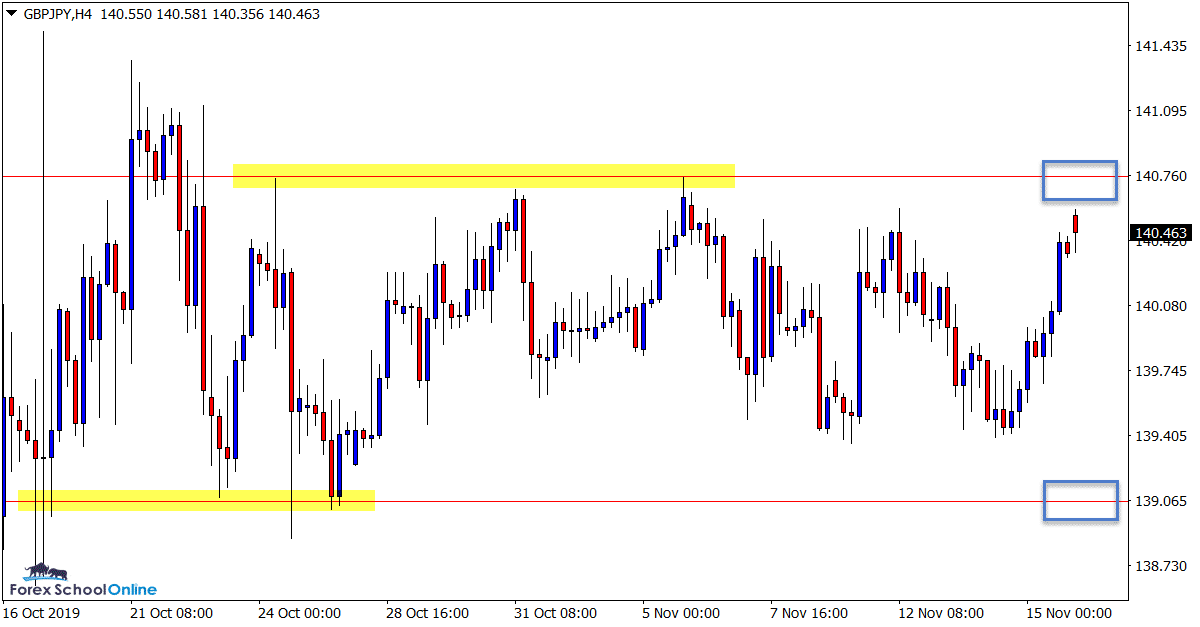
When price is so constricted playing the range can be incredibly tricky because there is a very fine line between making a profitable trade before getting whipsawed out.
The best play can often be to watch for the breakout or breakout and quick intraday retest trade setup.
Daily Chart
4 hour Chart
NZDJPY Daily and 4 Hour Charts
Watching for Breakout
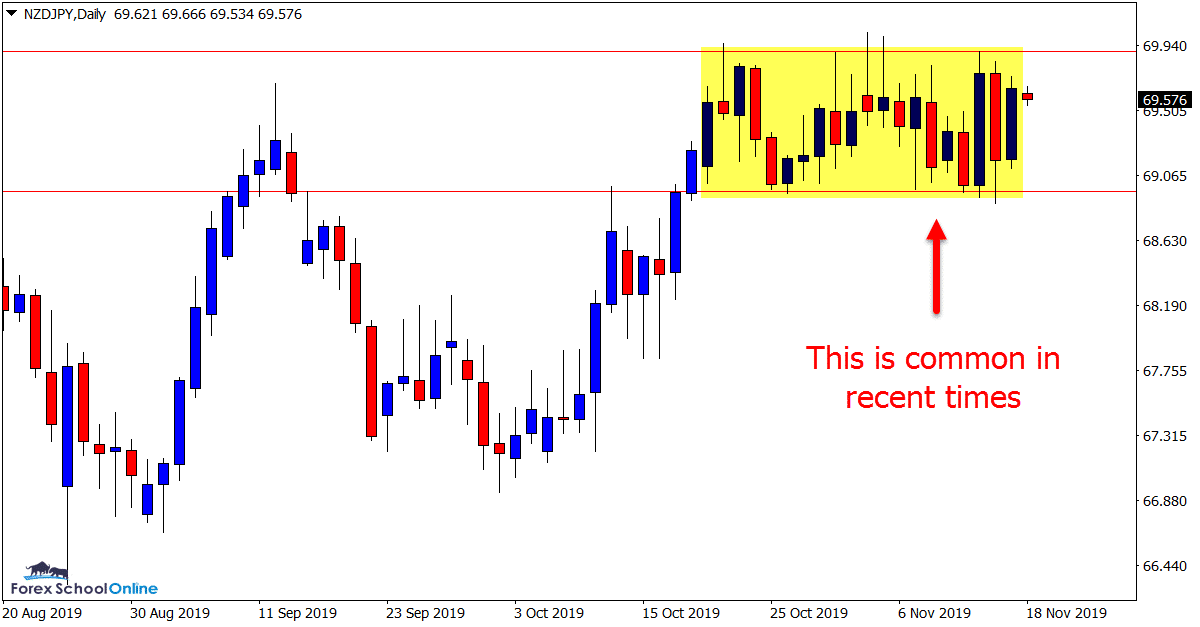
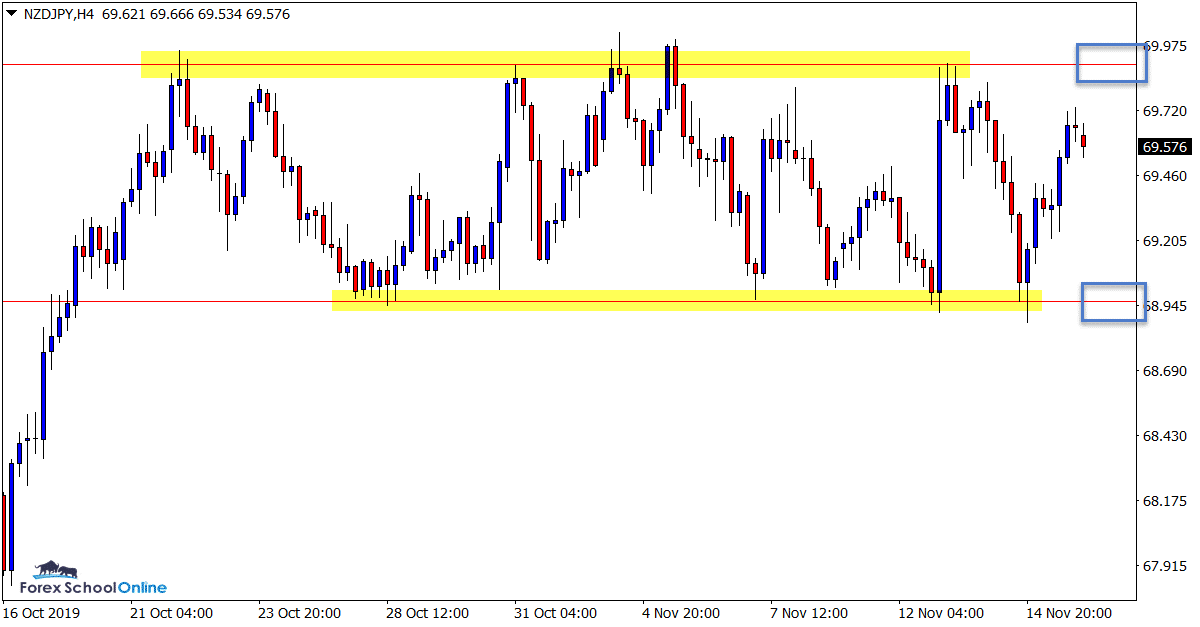
This is a similar looking price action chart to that of the GBPJPY with the major difference being there is a larger space between the range high and low.
This is important because whilst the GBPJPY is in a very tight box, the NZDJPY has more room to move and could offer potential range plays.
As the 4 hour chart shows below; there is a clearly set out support and resistance that also offers a lot more space between them.
This could offer potential range trades or similar to the GBPJPY breakout trade setups.
Daily Chart
4 hour Chart
Note: We Use Correct ‘New York Close 5 Day Charts’ – You can read about why these are important and how to download the correct free charts at Correct Free New York Close Demo Charts
Trade Ideas Note: All views, discussions and posts in the ‘charts in focus trade ideas’ are the view of Forex School Online and are not recommendations or trading advice. All posts are general in nature and are not advice to buy or sell.
Please leave questions or comments in the comments section below;


Do you train newbies?
Checkout free beginners course here; https://www.forexschoolonline.com//forex-school-beginner-course
Worderful
👍👍