Weekly Price Action Trade Ideas – 18th Dec 2018
Markets Discussed Today: AUDUSD, GBPUSD, GOLD and BITCOIN
GBPUSD Daily Chart
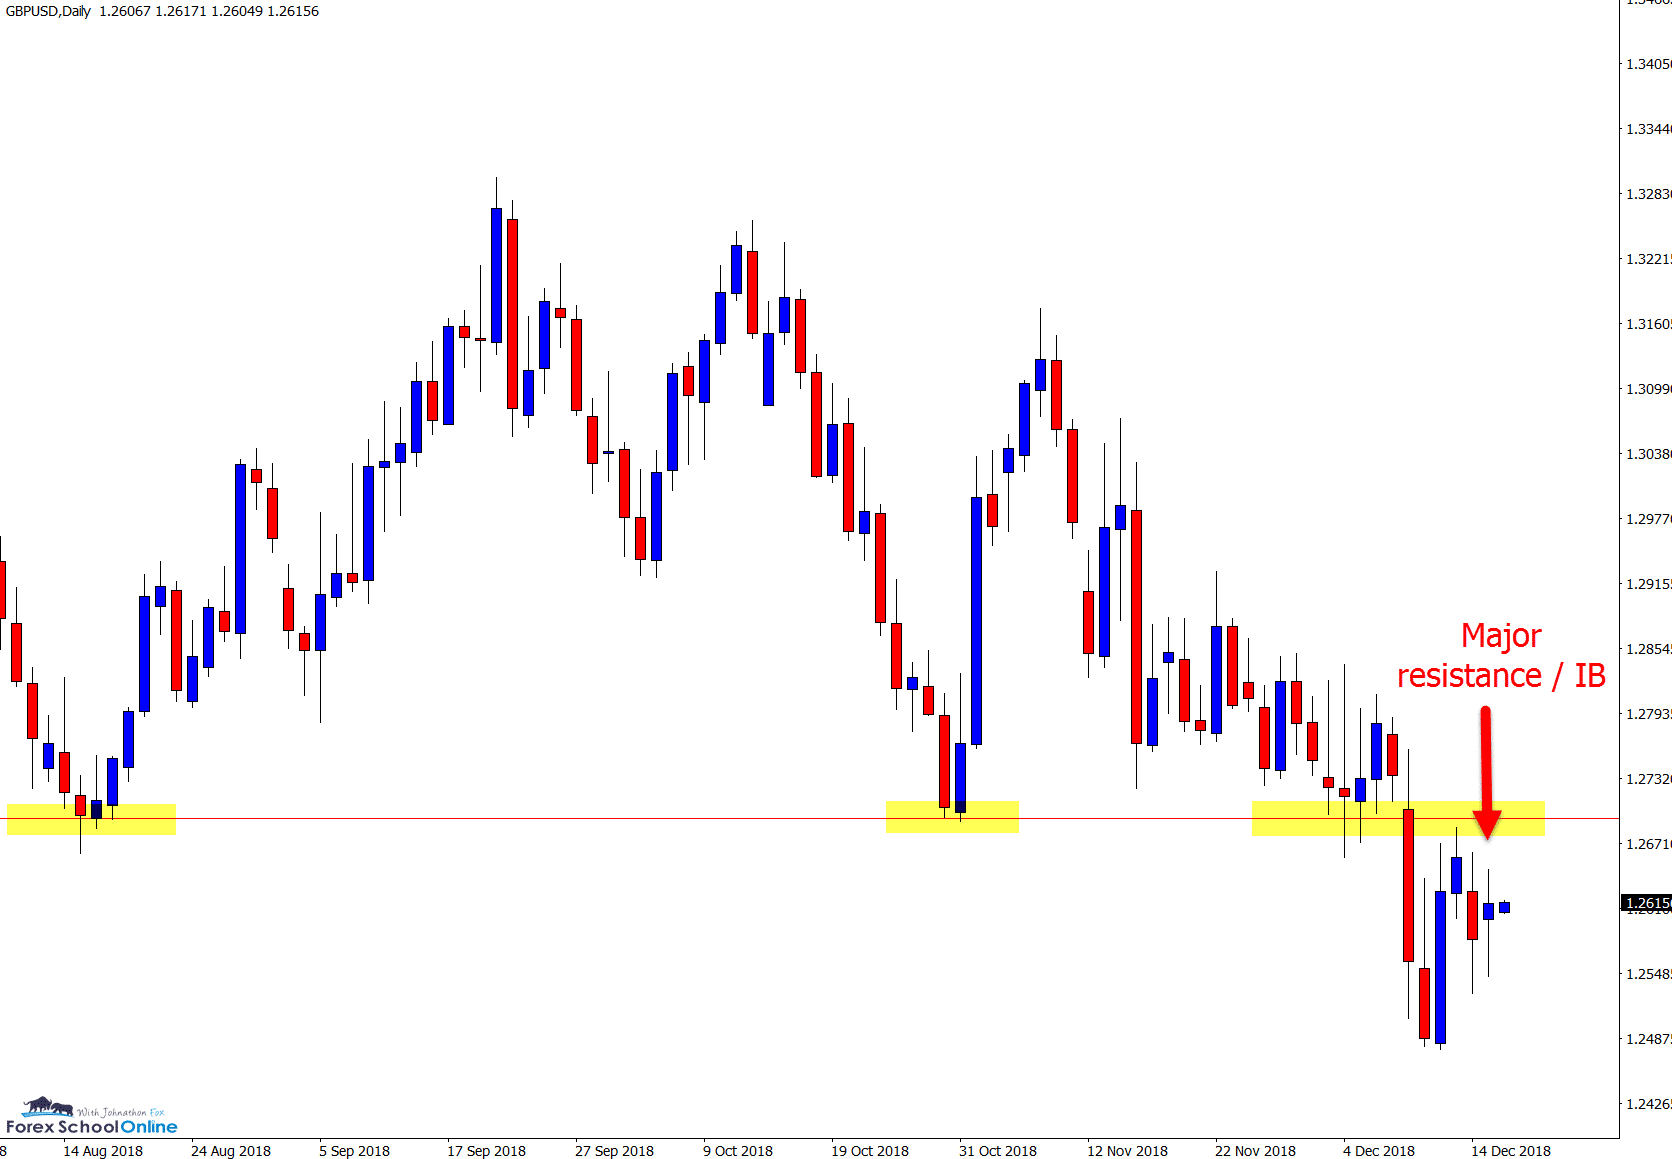
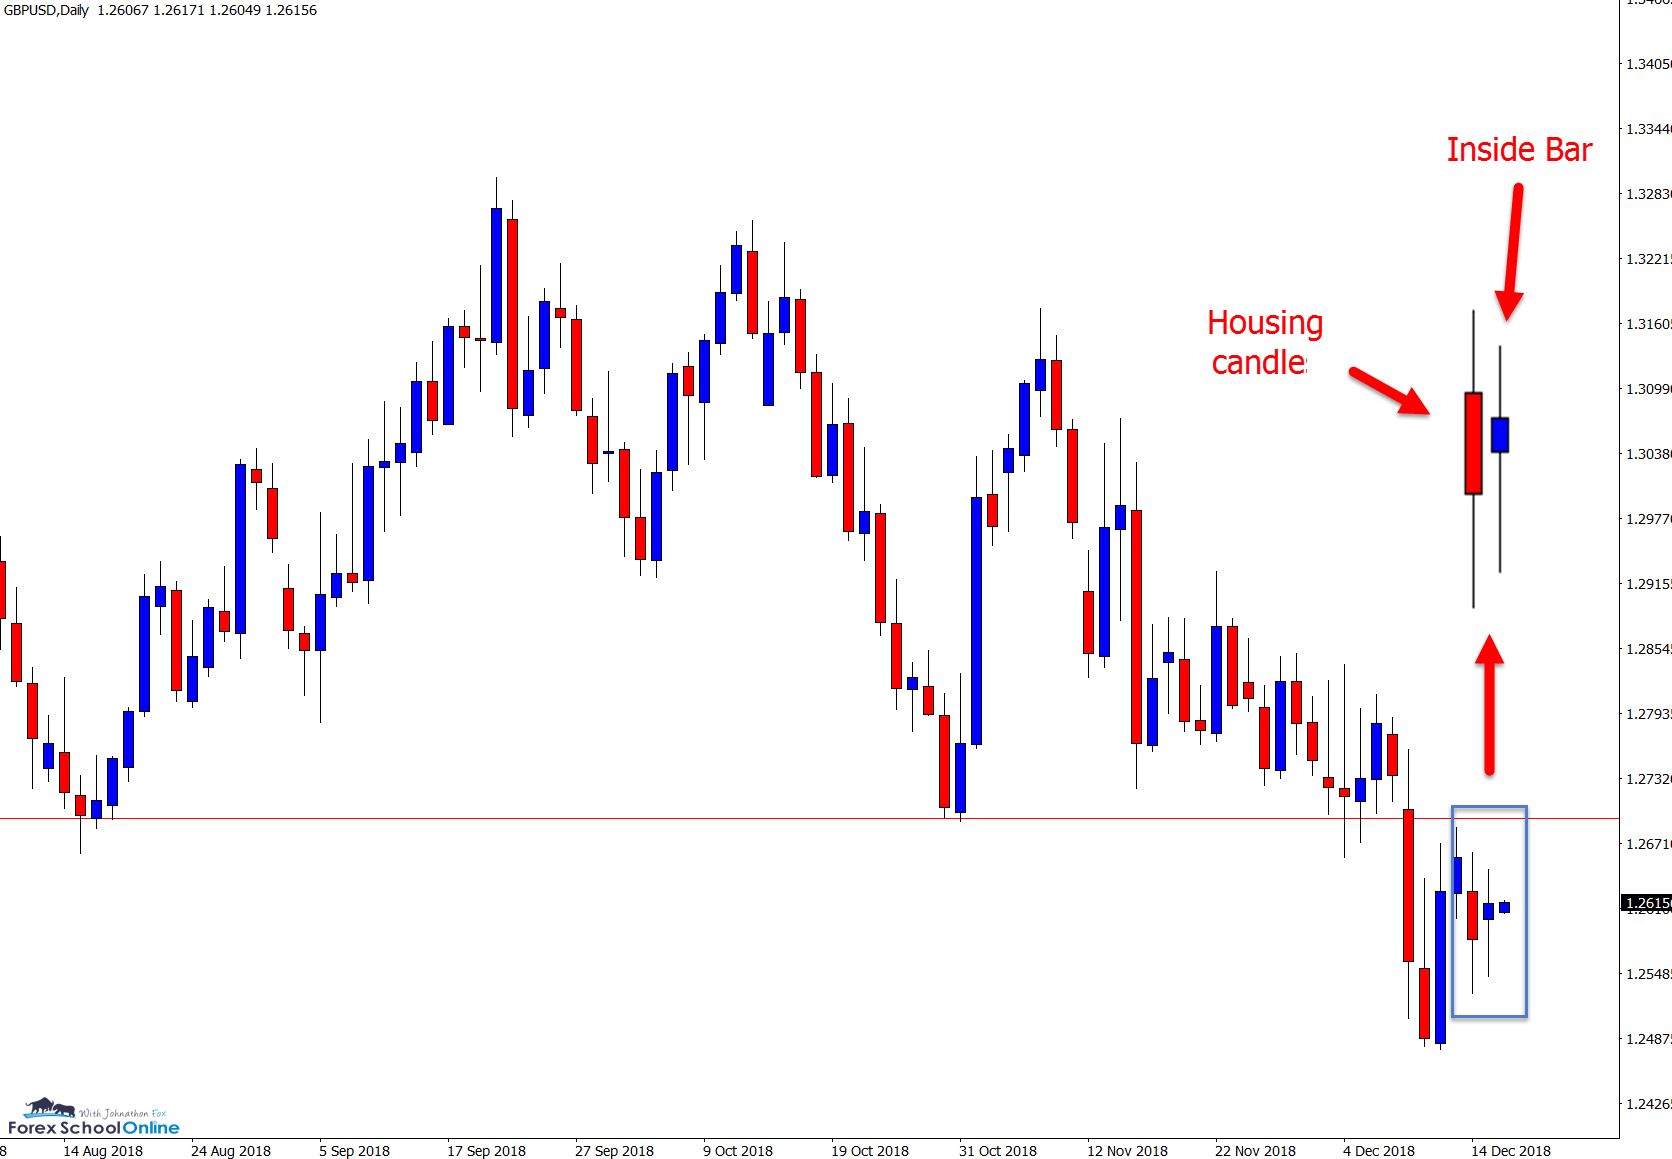
Price Breaks Out and Re-Tests With Inside Bar
Before last week’s summary we had not discussed the GBPUSD for quite some time. The reason for that is simply because price had not been doing a whole heap other than moving sideways.
Leading into last week’s summary we could see price looking to test the major support level. This was off the back of price winding up and then forming an inside bar.
Before going into the sideways movement and prolonged consolidation, price had been trading heavily lower. Since that movement lower there had been no signs of a reversal or trend back higher.
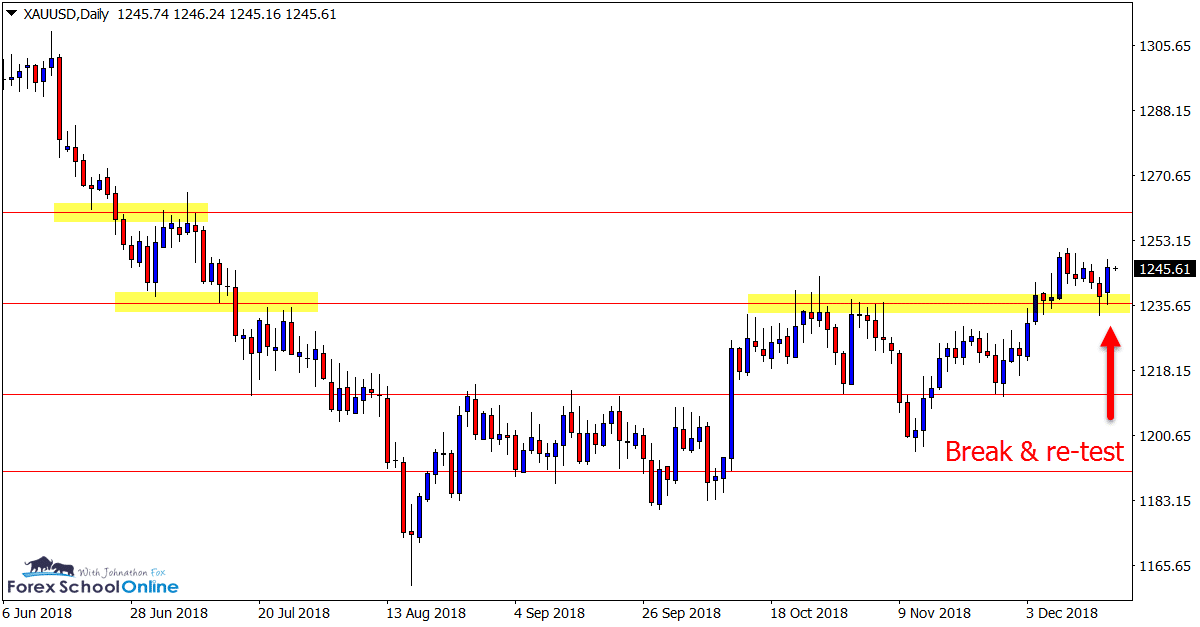
Below I discuss price action in the Gold market and how we have been watching the reversal from the down-trend occur over the last few weeks. We had not seen that sort of bottom and reversal here, leading to another breakout, re-test and now inside bar just under the old support and potential new resistance level.
Daily Chart
Daily Chart
AUDUSD Daily Chart
Move Lower From BEEB Into Crucial Support
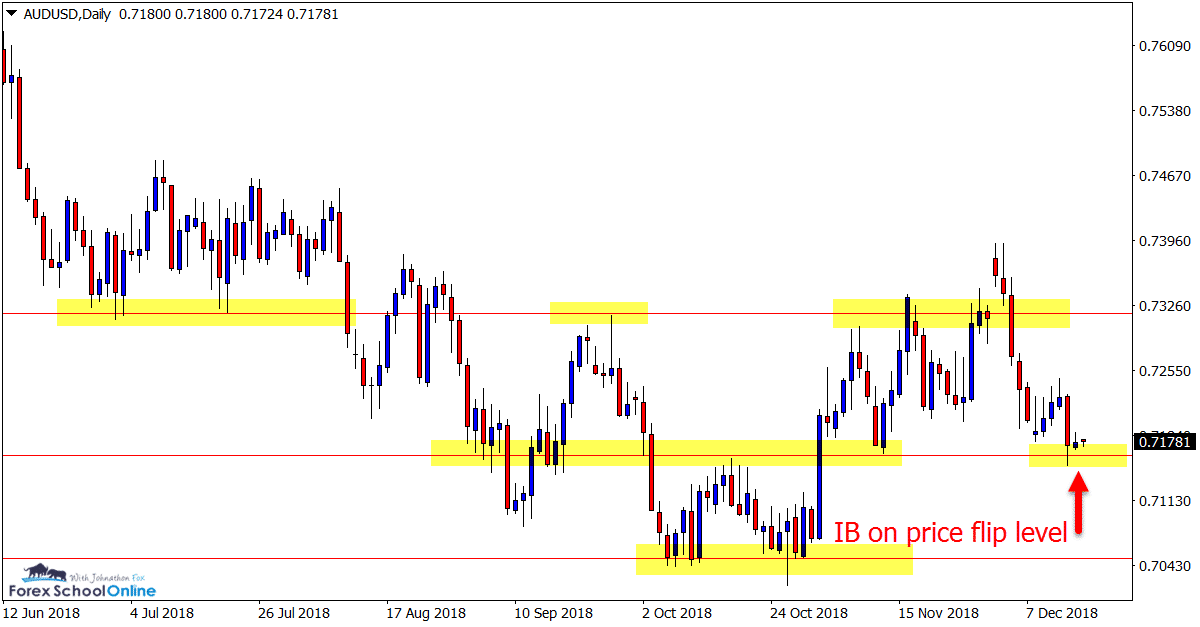
This is another market we discussed last week, this time price forming a false break of the resistance level with a large Bearish Engulfing Bar = BEEB.
Price sold lower from the BEEB and has now moved into a crucial price flip support level.
This level has proven itself as a solid support and resistance level in recent times. We can see on the chart below; price has halted and formed a very small inside bar showing there is some indecision at this level.
If price breaks lower, then it could move quickly into the major lows. However; a bounce higher and it would not surprise to see consolidation and ranging price action with potential breakout plays at the major resistance.
Daily Chart
Gold Daily & 12 Hour Charts
New Momentum In Play
Whilst it was a struggle, price has broken through the key resistance.
Price in this market has sold off lower for a large chunk of this year and has slowly fought back towards the back-end.
As is so often the case; trends and momentum do not just turn around in one candle. Price needs to build, shake out the last of the buyers/sellers and build momentum in the opposite direction.
Trends will often continue because after a small retracement, fresh buyers or sellers will enter and regain control.
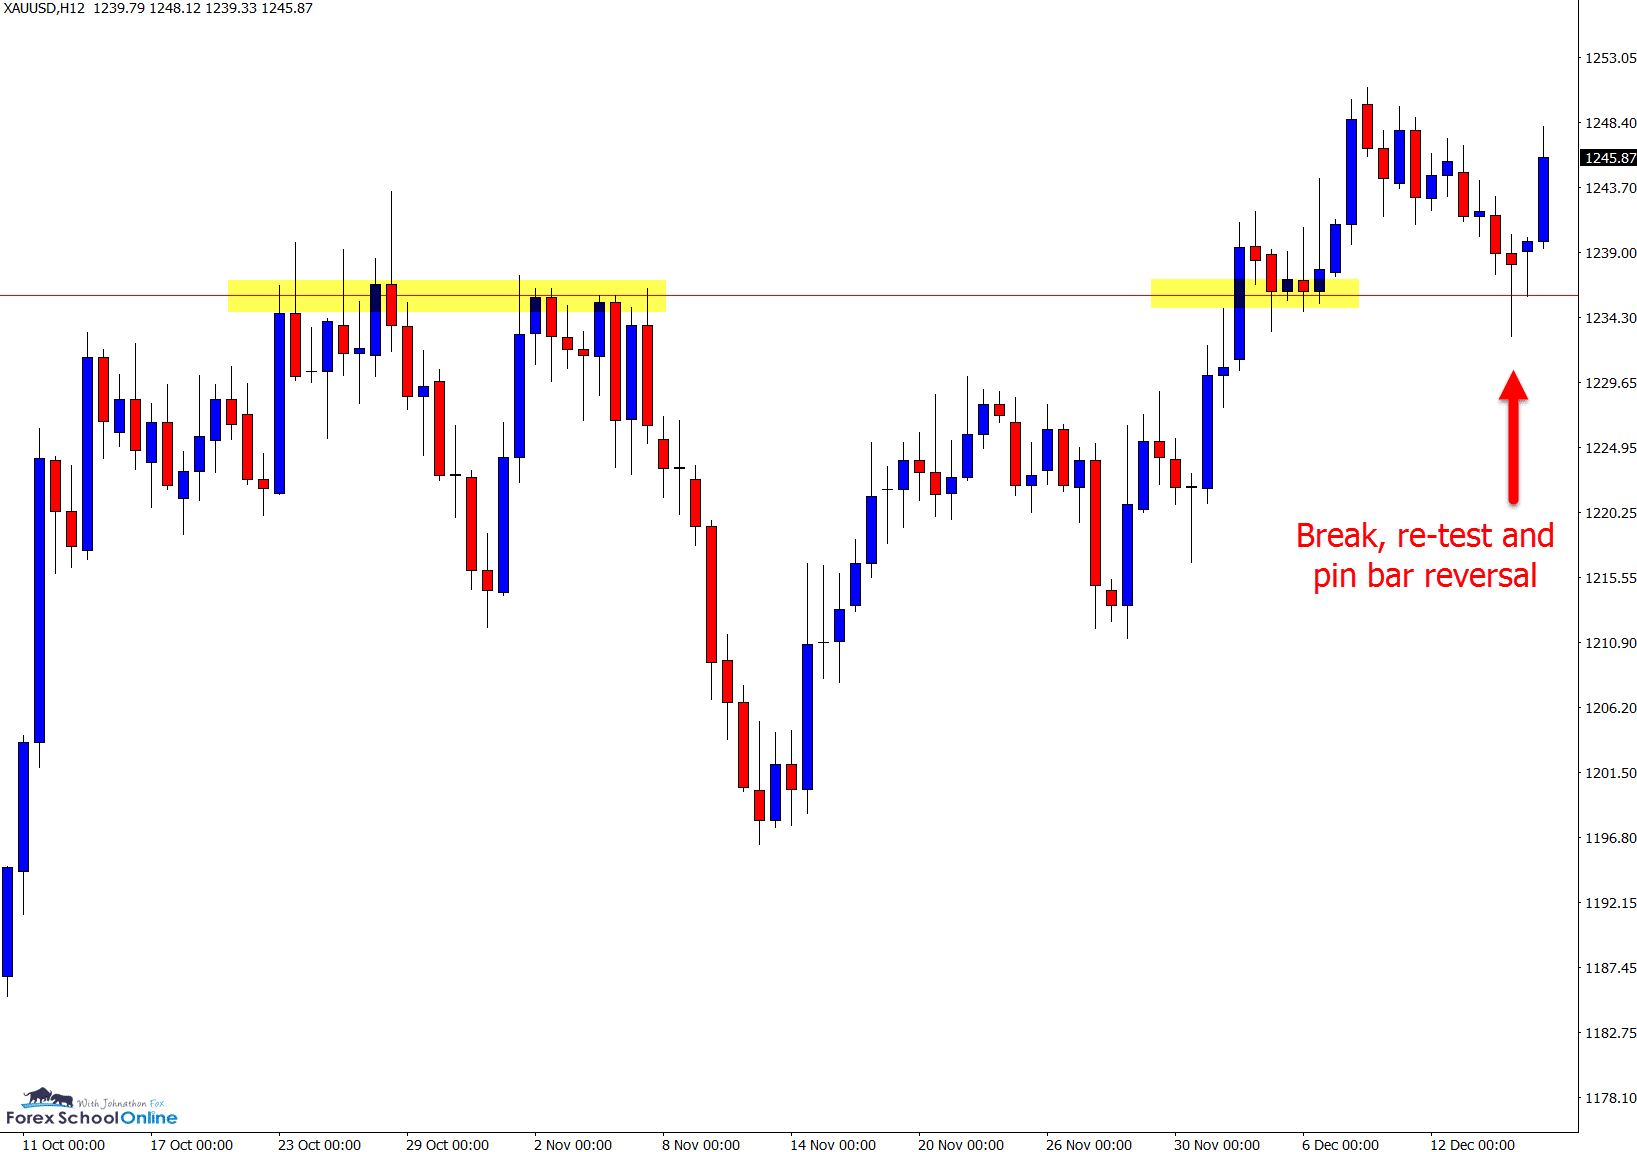
As we can see here; after a strong move lower on the daily chart, price formed a base low where price consolidated sideways. Price tried to push higher, was rejected when fresh sellers came in, and has now regained momentum by breaking the resistance and forming a new higher high.
We can also see on the 12 hour chart price formed a breakout of the major daily level and quick re-test pin bar reversal.
NOTE: To create different time frames on your New York close charts like the 12 hour charts, or any other time frame including 6 hour, 8hr, 12 hour and 2 day charts, you can download the free indicator here.
Daily Chart
12 Hour Chart
Bitcoin Daily Chart
VBRN Could Now be Tested
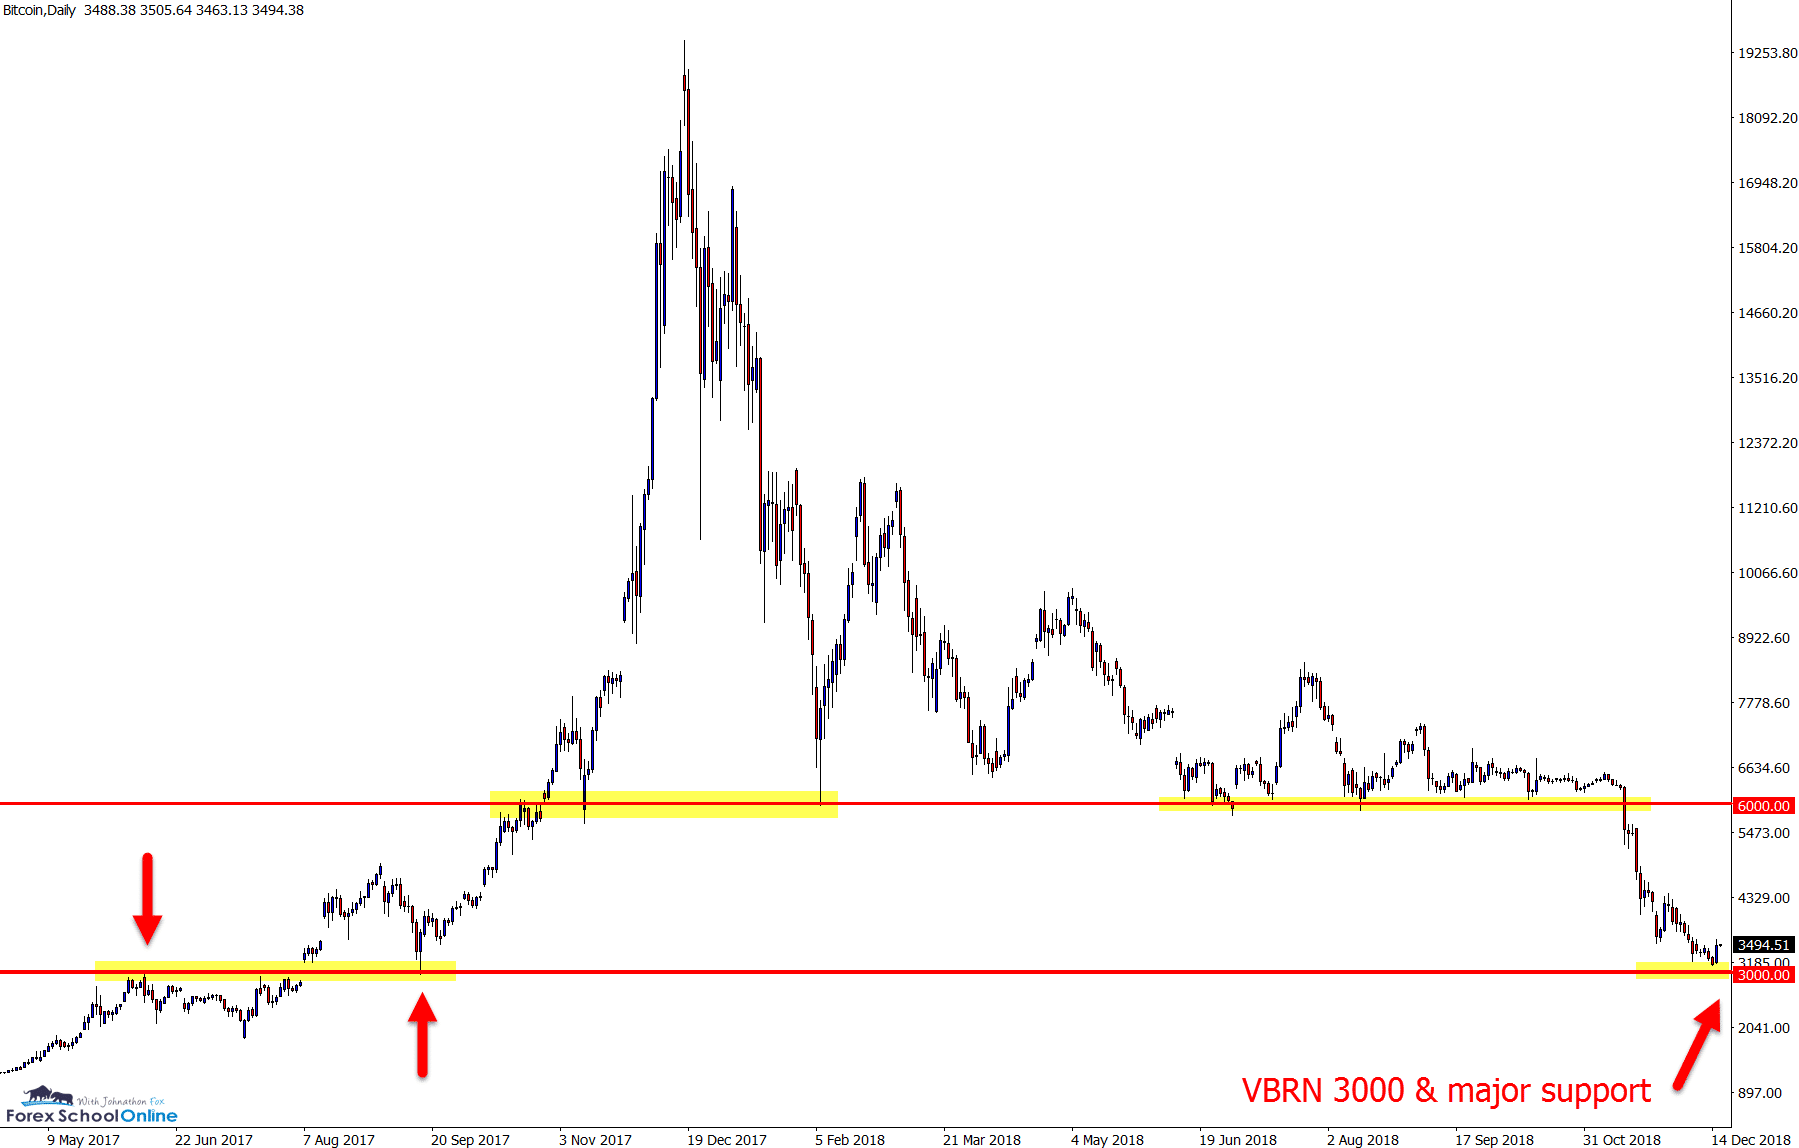
We have been discussing price action and the major levels in the Bitcoin market regularly of late.
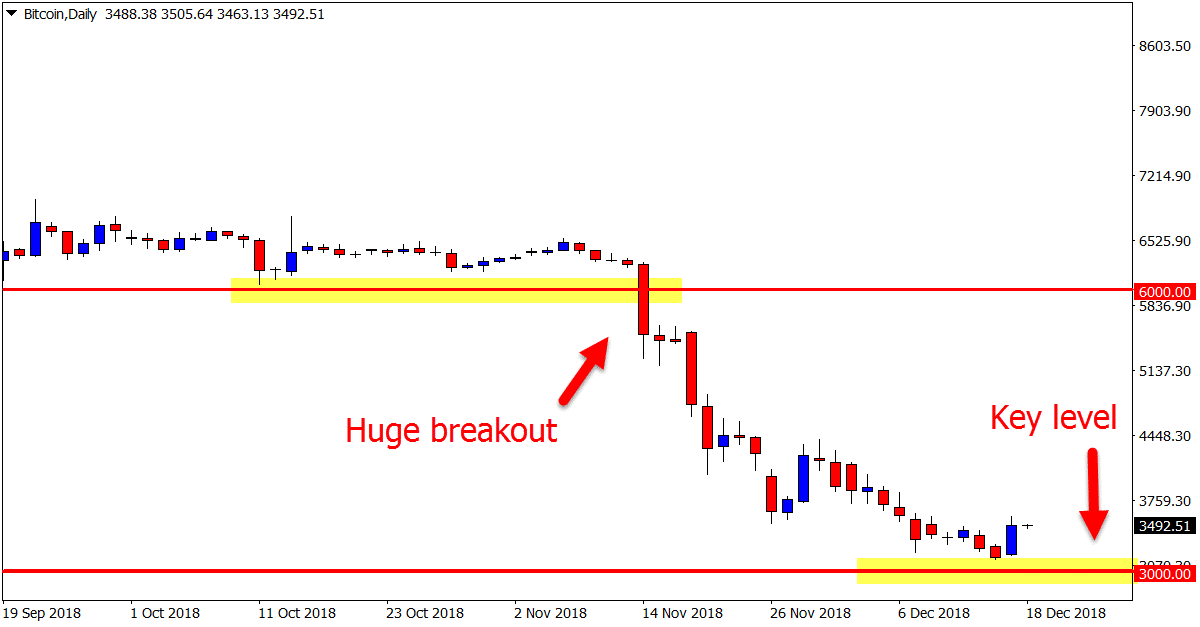
After a long period of nothing much interesting happening and waiting for price to break the Very Big Round Number = VBRN 6000 discussed in the October trade ideas summary, price slammed lower.
As we posted in the Nov 20th Summary we were looking to see if price could move into the next VBRN of 3000.
Price at this stage is hovering just above this level and consolidating. This level looks crucial to where price moves next.
A break lower and we could see another large sell off to around the 2100 level.
Daily Chart
Daily Chart
Note: We Use Correct ‘New York Close 5 Day Charts’ – Download Free New York Close Demo Charts Here
Charts in Focus Note: All views, discussions and posts in the ‘charts in focus’ are the view of Forex School Online and are not recommendations or trading advice. All posts are general in nature and are not advice to buy or sell.
Please leave questions or comments in the comments section below;


Leave a Reply