Weekly Price Action Trade Ideas – 17th to 21st June
Markets Discussed in This Week’s Trade Ideas: EURUSD, GBPCHF, USDSGD and NZDJPY.
EURUSD Daily Chart
Engulfing Bar Sends Price Back Into Range
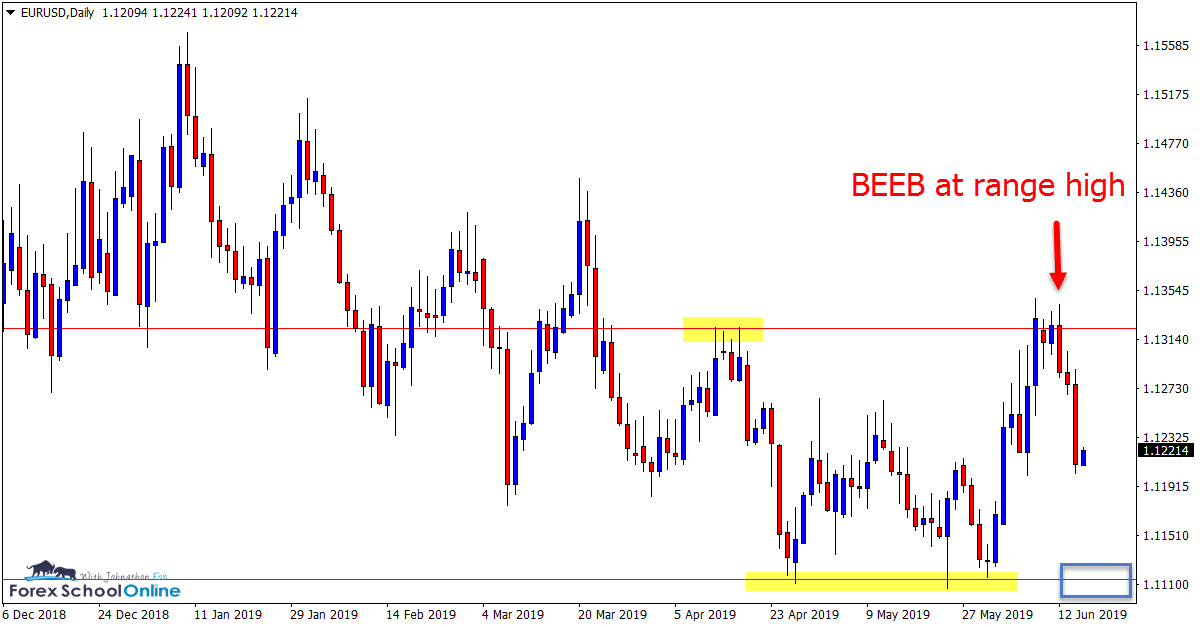
Price action on the EURUSD daily chart has been stuck in a sideways range for many months now.We have been posting and discussing this range and the best way to play it for some time.
Back on the 22nd of May’s trade ideas we were looking at the range low and this same range low could now come into play again.
Range trades can be tricky because there are a lot of minor levels in between the range high and low.
As the daily chart shows below; price formed an engulfing bar at the range high for price to sell off lower. If price can move back into the low and support level, it could prove a major level to watch.
Daily Chart
USDSGD Daily and 4 Hour Charts
Price Breaks and Flips
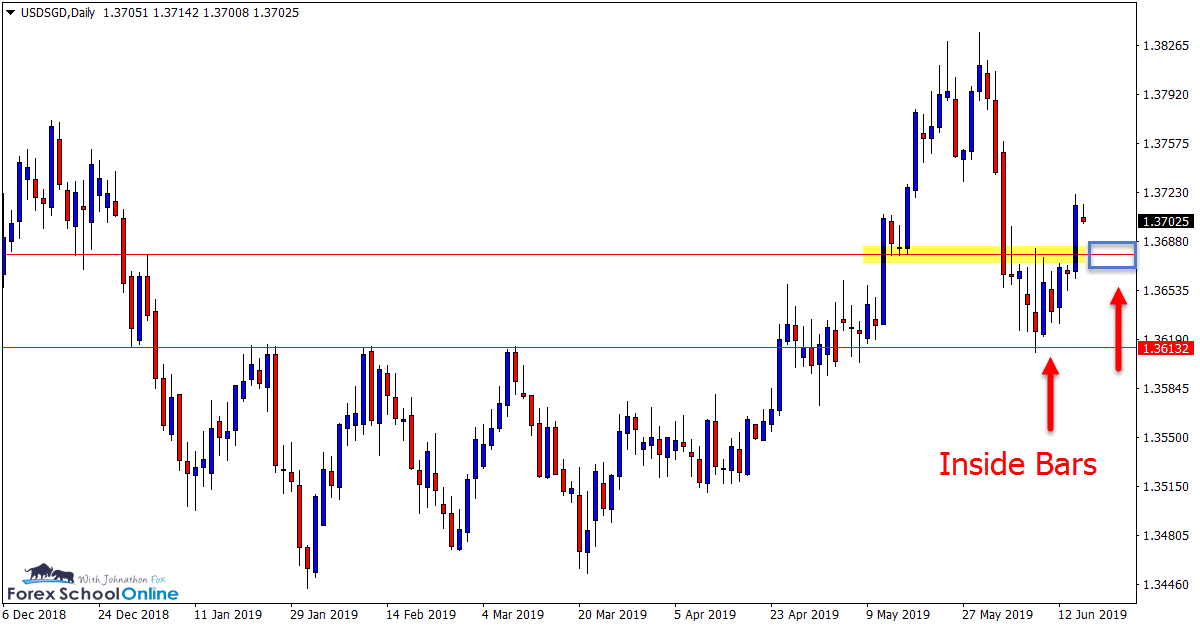
Last week I posted about the inside bar that the USDSGD had printed on the daily chart.
The support level and inside bar lows that price was sitting on managed to hold. Price created more inside bars before bursting out higher.
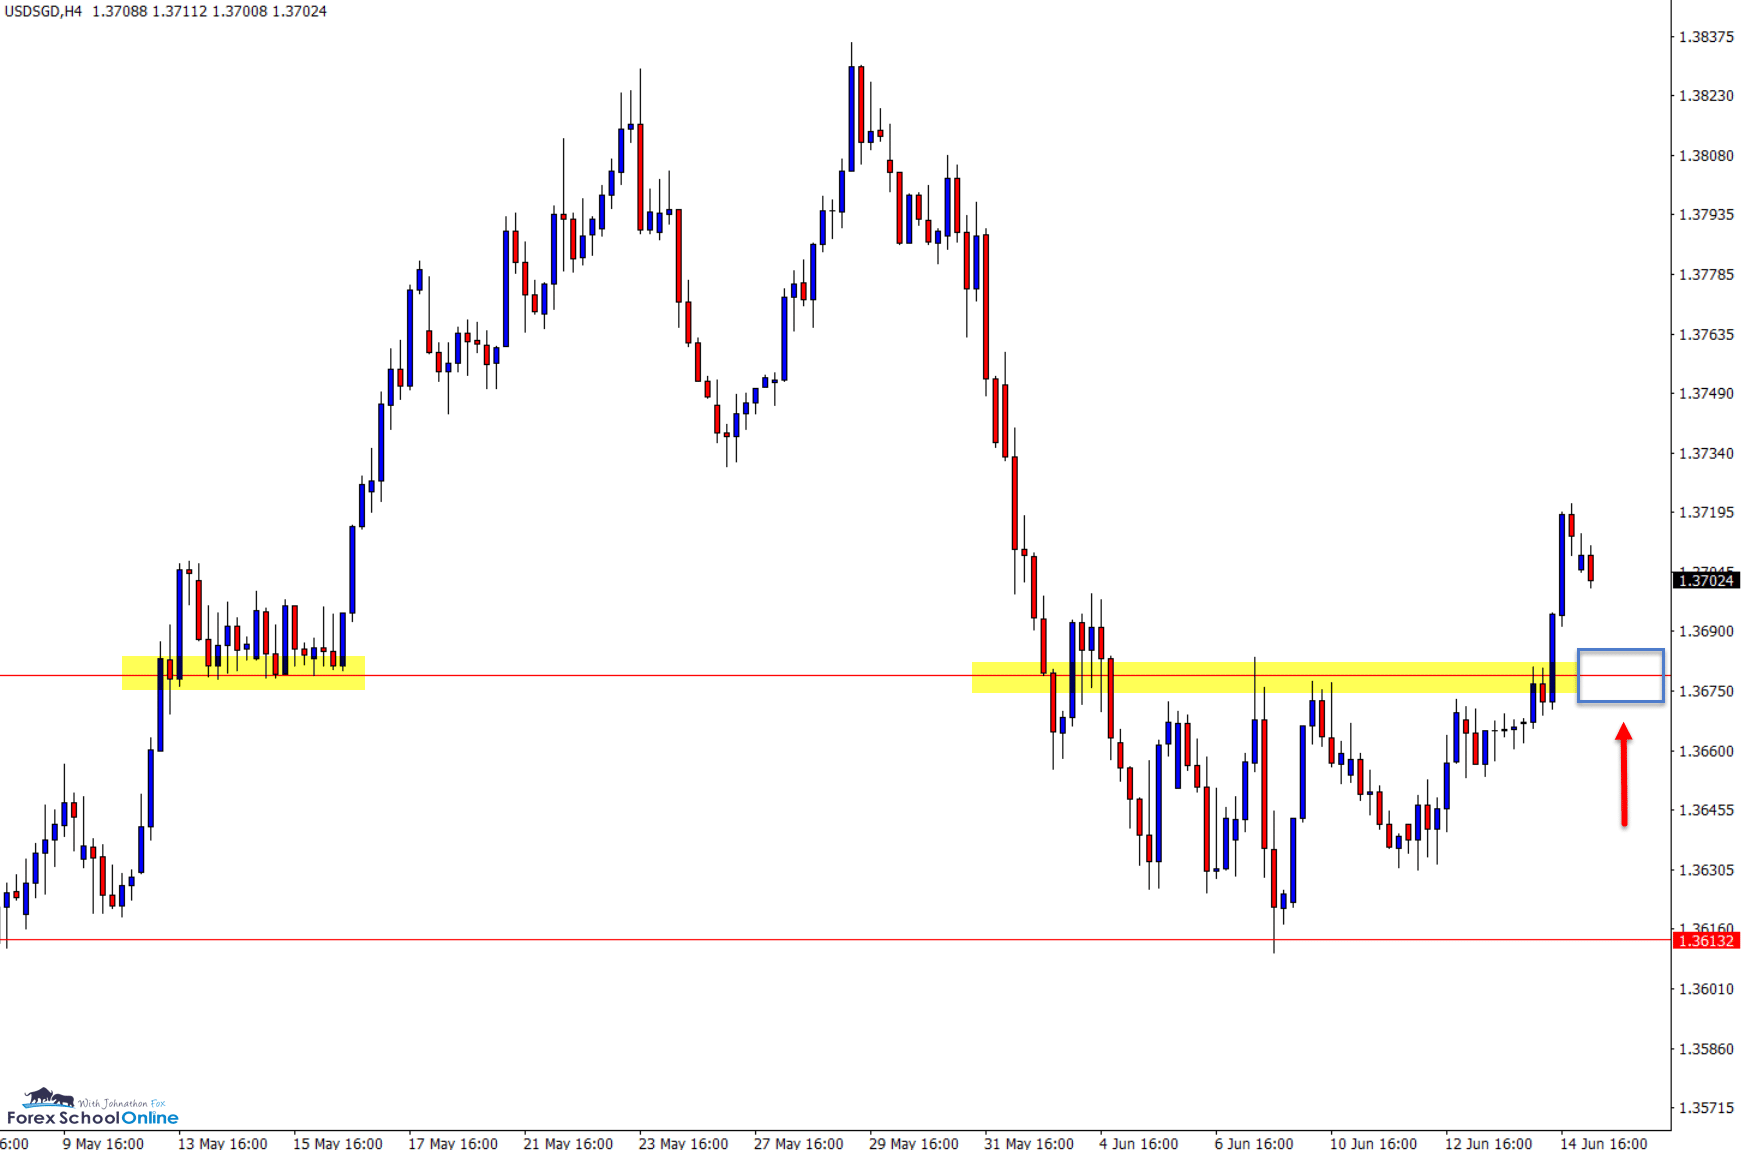
As both the daily and 4 hour charts show below; this old resistance that price has busted out of could now act as a price flip new support level.
If price can retrace back into this new support, high probability bullish trades could be hunted on intraday time frames such as the 4 hour and 1 hour charts.
Daily Chart
4 Hour Chart
NZDJPY Weekly and 1 Hour Chart
Possible Retrace For Bears
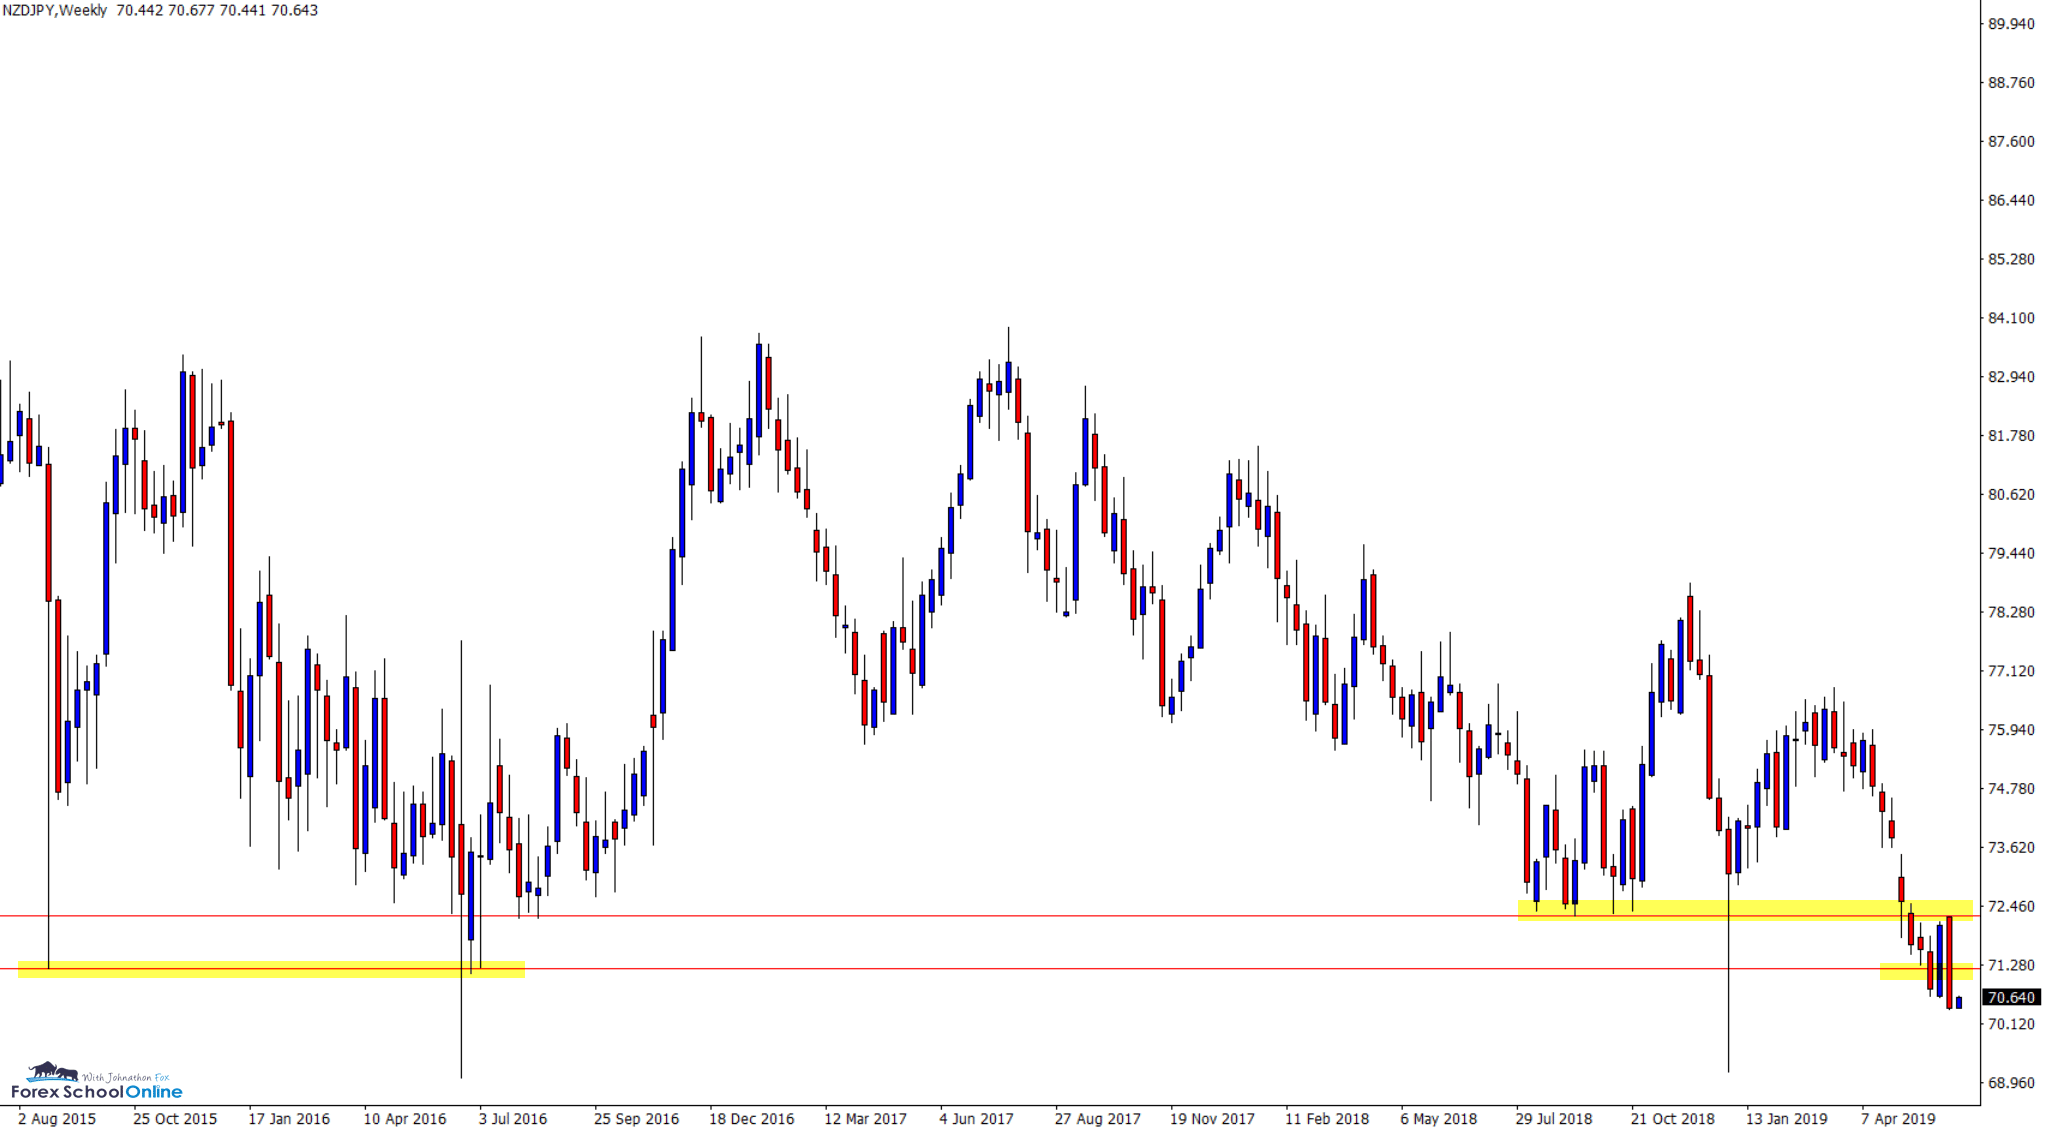
In last week’s trade ideas we discussed this market and the Bearish Engulfing Bar – BEEB that had formed on the daily chart.
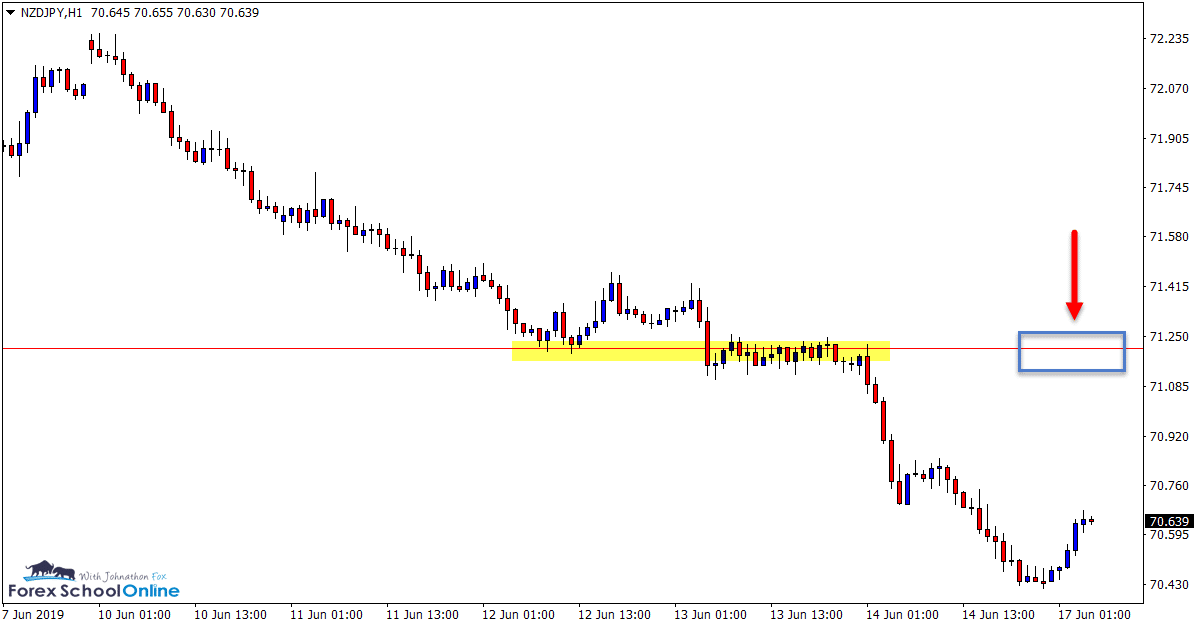
After price broke the low of the engulfing bar, it moved lower and into the next support level with a heavy sell-off.
The momentum in this market has been to the downside of late and looking to trade inline with this move lower could be the solid play.
If price can retrace back higher and into the overhead level we could look for intraday short trades with high probability bearish trade setups.
I have attached the weekly and 1 hour charts below showing the level overhead price could retrace back into.
Weekly Chart
1 Hour Chart
GBPCHF Daily and 4 Hour Charts
Holding Pattern
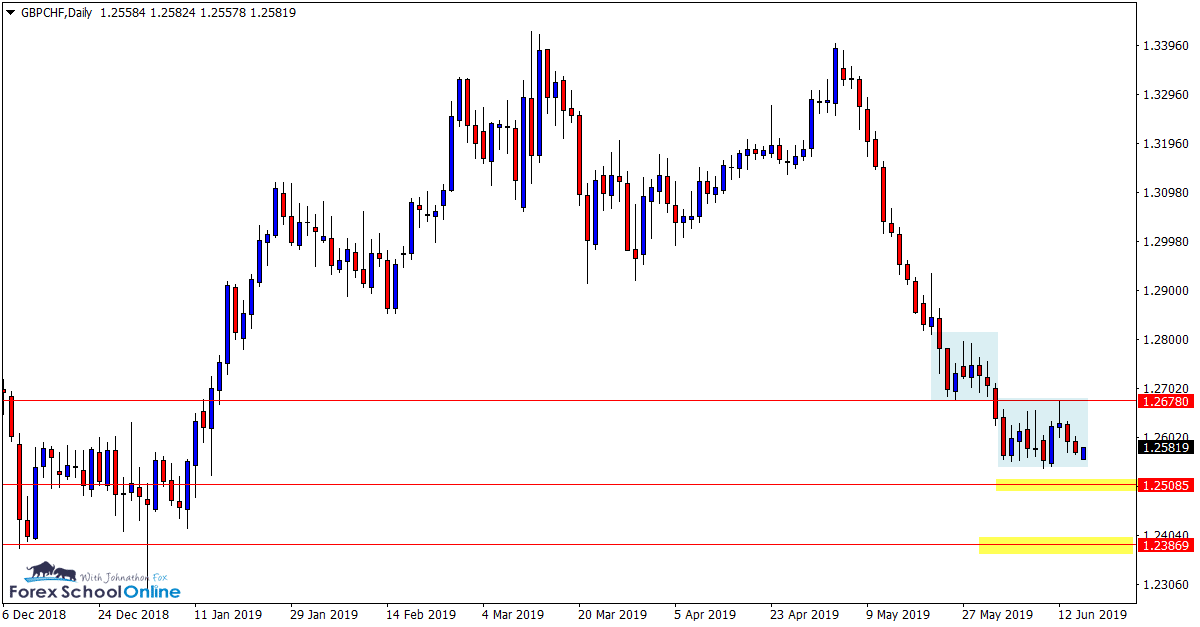
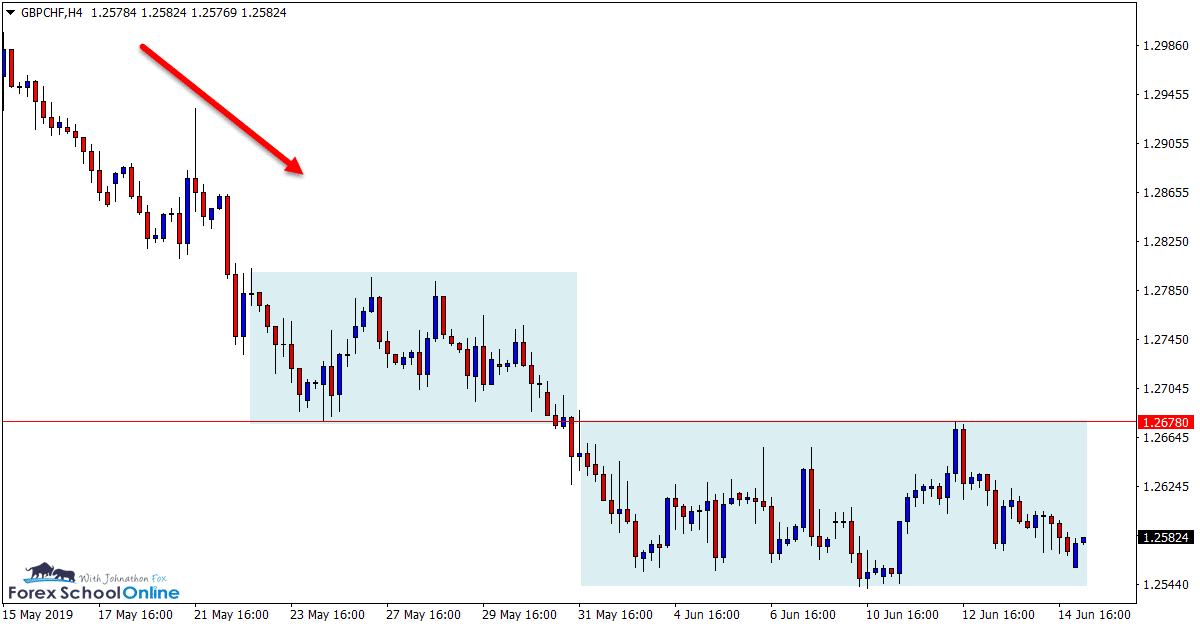
Price action is in a holding pattern on the GBPCHF.
The 4 hour chart below shows this the clearest with price making a strong move lower, pausing sideways, before breaking and moving sideways again.
We often discuss how price will move, consolidate and then move again. You can read further about this in the lesson; Important Price Action Market Rules.
If this pattern continues we can watch to see if price breaks lower again out of the consolidation and look for breakout and quick intraday re-test trade setups.
Daily Chart
4 Hour Chart
Note: We Use Correct ‘New York Close 5 Day Charts’ – You can read about why we use these and how to download the correct free charts at Correct Free New York Close Demo Charts
Trade Ideas Note: All views, discussions and posts in the ‘charts in focus’ are the view of Forex School Online and are not recommendations or trading advice. All posts are general in nature and are not advice to buy or sell.
Please leave questions or comments in the comments section below;


Leave a Reply