Weekly Price Action Trade Ideas – 16th to 20th September 2019
Markets Discussed in This Week’s Trade Ideas: EURUSD, GBPNZD, EURSGD and US500.
EURUSD Daily and 12 Hour Charts
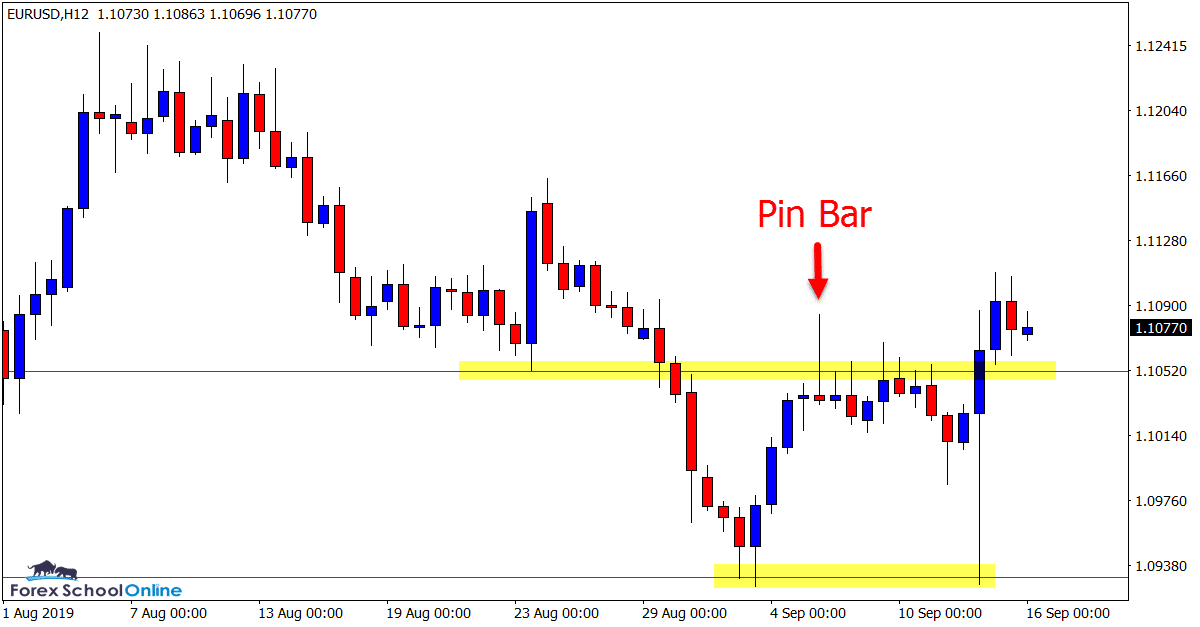
Pin Bar Snaps Into Support
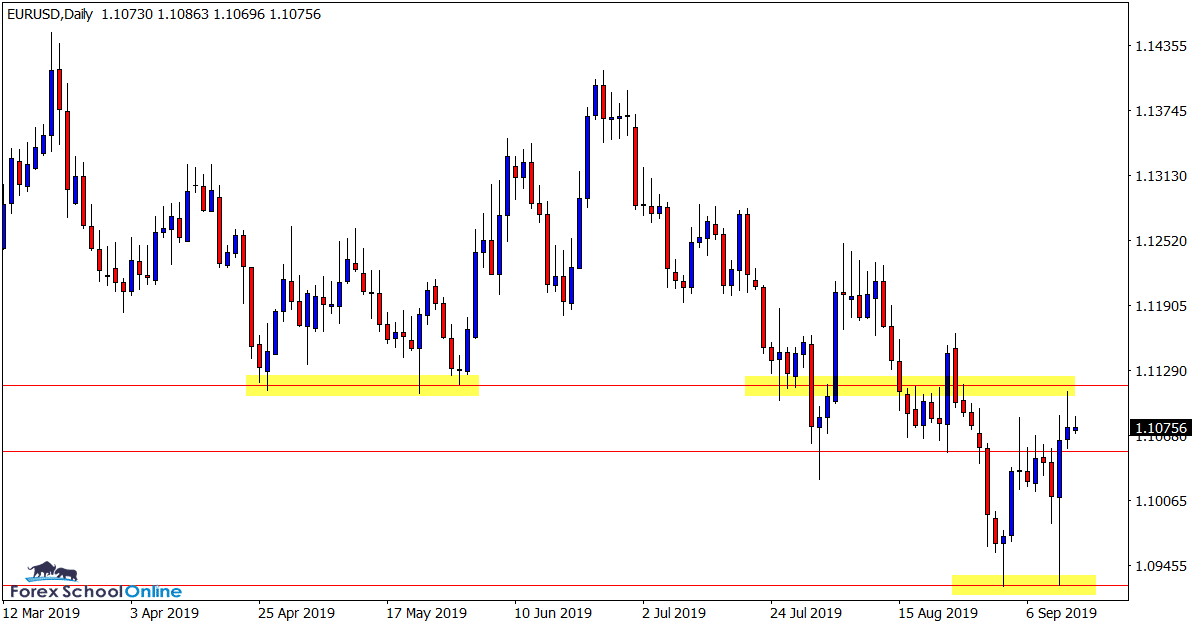
In last week’s trade ideas we discussed both the daily and 12 hour pin bars price had formed on the EURUSD after price had rotated back into the recent resistance zone.
After price finally broke lower and below the pin bars, price snapped straight into the near term support level, only for the bulls to jump straight in and pound price back higher.
This has been an interesting market of late to say the least. When price looks like breaking and making an extended move in one direction it finds a way to bounce back and once again move back to where it was in previous months.
The near term overhead resistance in this market looks to be key. If this breaks and price moves right back into the range, then more consolidation / ranging looks to be on the cards.
Daily Chart
12 Hour Chart
NOTE: If you want to create 12 hour charts (or any time frame) on your MT4 charts, get the free indicator at; Create Any Time Frames on MT4
GBPNZD Daily and 4 Hour Charts
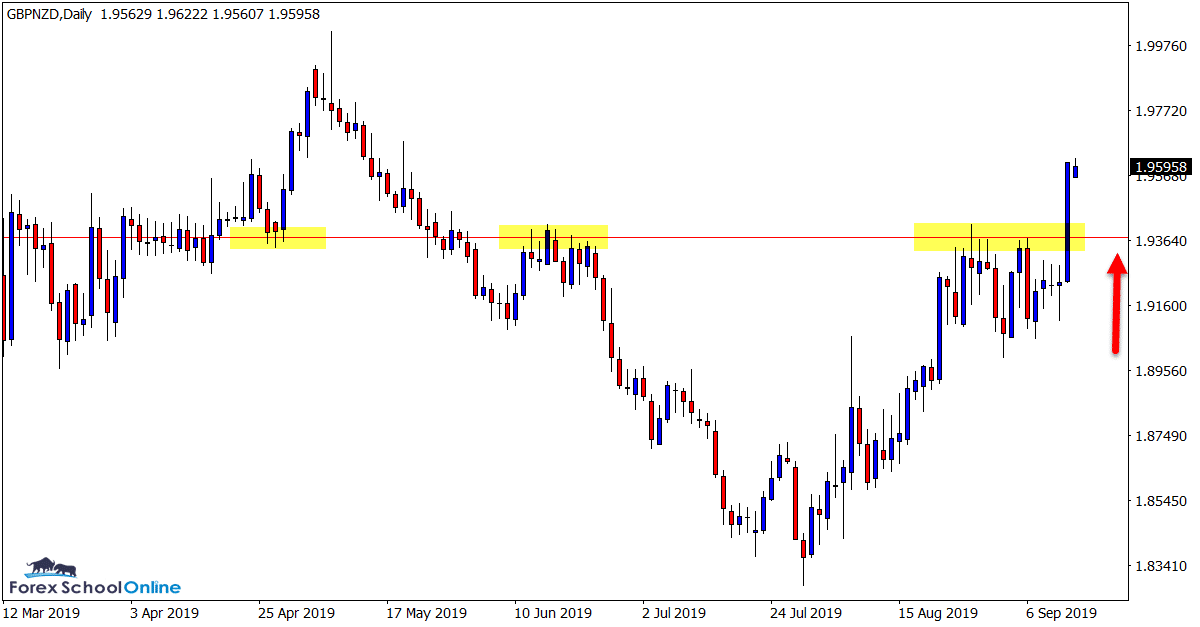
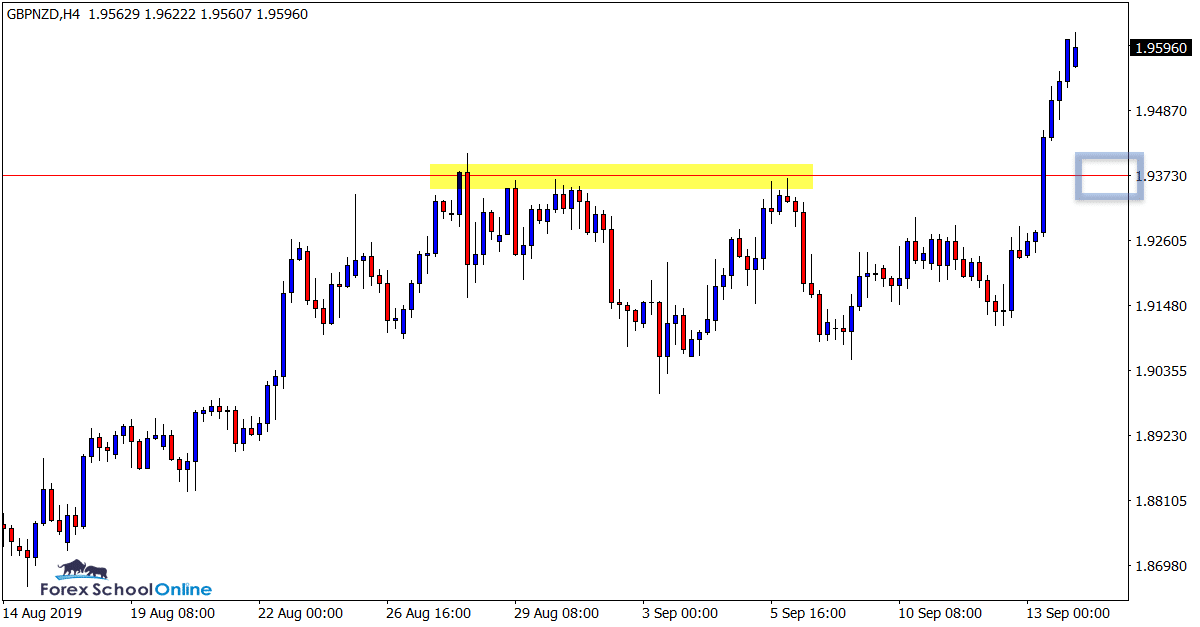
Price Breaks Out Higher With Momentum
Price on the daily chart of the GBPNZD has broken out with a solid move in the last few sessions inline with the recent strong move higher.
Price had been consolidating at the major resistance level, but once it broke, it did so aggressively.
If price can make a quick rotation back lower, the old resistance could flip and look to act as a new support level. This could be a solid potential area to watch for A+ bullish triggers and price action clues to get long at the major level inline with the recent move higher.
Daily Chart
4 Hour Chart
EURSGD Daily Chart
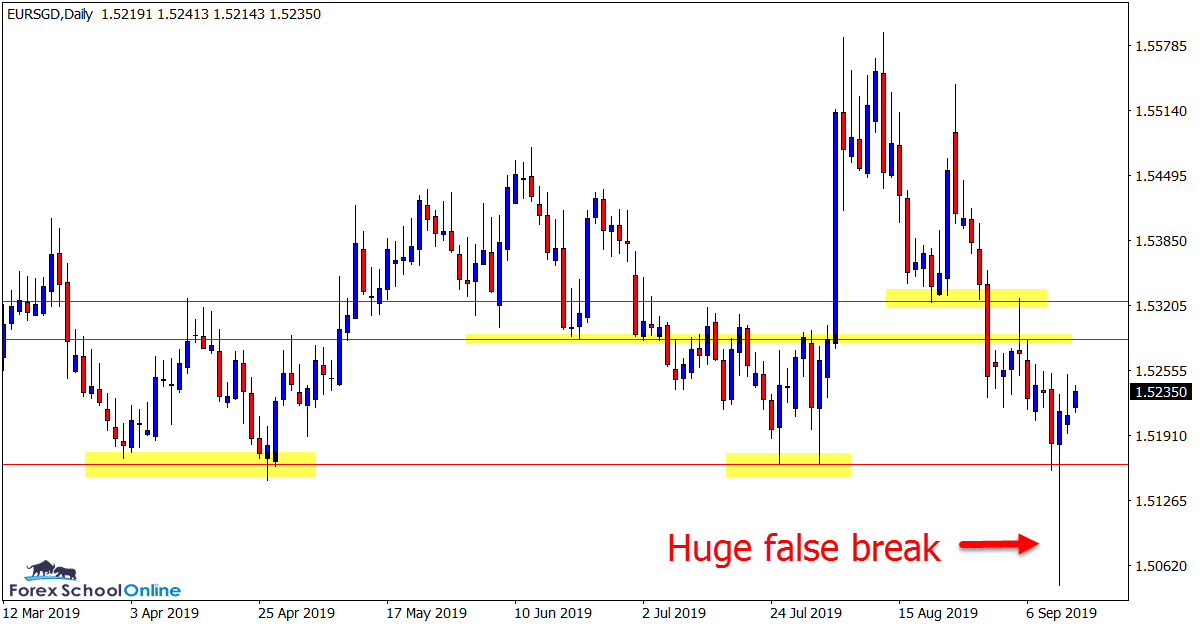
False Break Pin Bar
Price has formed a huge bullish false break pin bar on the daily chart of this market.
Whilst this is a huge bullish false break, price is also moving directly back into a host of potential trouble areas as are marked on the chart below.
Without a clear trend in recent times, these trouble areas and minor resistance zones could prove tricky for any fast paced bullish moves higher and offer some difficult trade management decisions for any traders bullish in this pair.
Daily Chart
US500 Daily and 4 Hour Charts
Price Stalls at Major Resistance
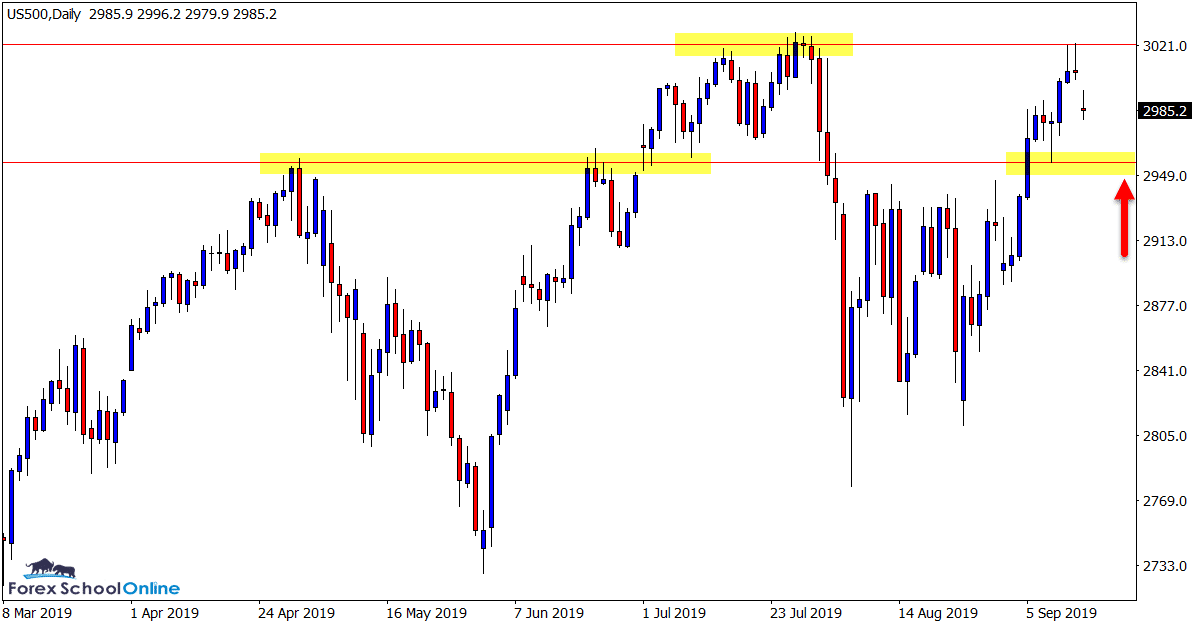
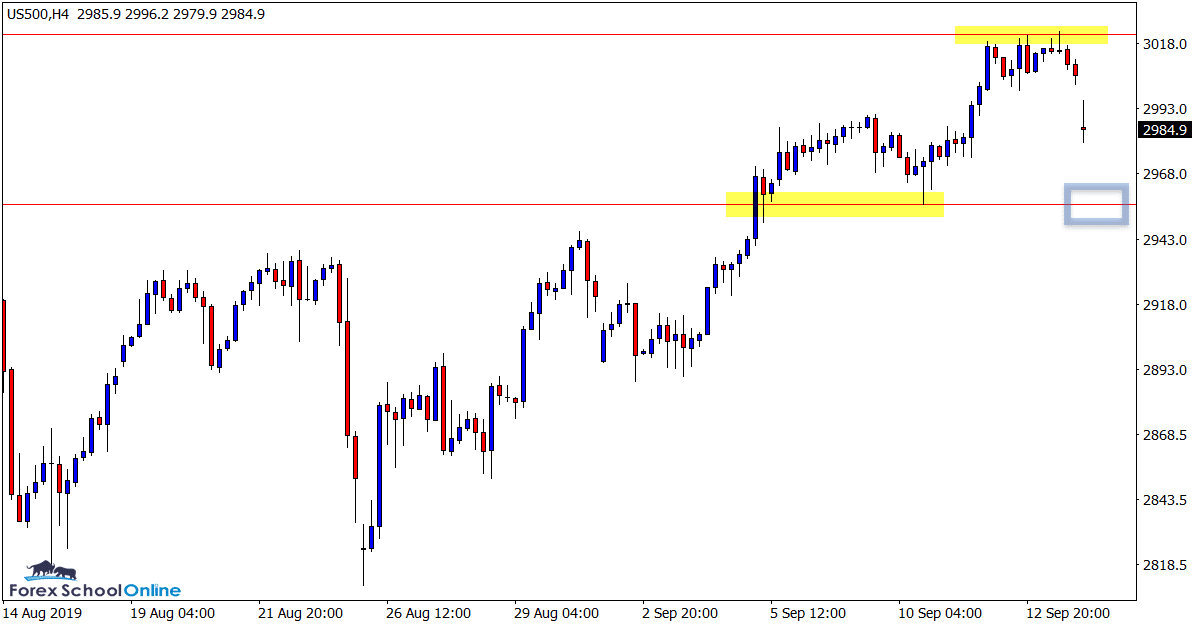
Price on the daily chart of this pair has made a sharp run higher in recent times to make a fresh attempt at the extreme highs.
As the daily chart shows below; price strongly broke out of the consolidation box that it was trading within and ran straight to the overhead resistance.
Both the major resistance and the old box resistance / new support look crucial.
If price makes a quick rotation lower into the price flip support it could be a potential area to hunt for long trades. If we get another test of the resistance, bullish traders can watch for breakouts.
Daily Chart
4 Hour Chart
Note: We Use Correct ‘New York Close 5 Day Charts’ – You can read about why we use these and how to download the correct free charts at Correct Free New York Close Demo Charts
Trade Ideas Note: All views, discussions and posts in the ‘charts in focus trade ideas’ are the view of Forex School Online and are not recommendations or trading advice. All posts are general in nature and are not advice to buy or sell.
Please leave questions or comments in the comments section below;


Dear Teacher,
Could You analyze On Pair XauUsd?