Weekly Price Action Trade Ideas – 16th to 20th Nov 2020
Markets Discussed in This Week’s Trade Ideas: GBPJPY, NZDJPY, EURNZD and US500.
Note: We Use Correct ‘New York Close 5 Day Charts’ – You can read about why we use these and how to download the correct free charts at Correct Free New York Close Demo Charts
GBPJPY Daily Chart
-
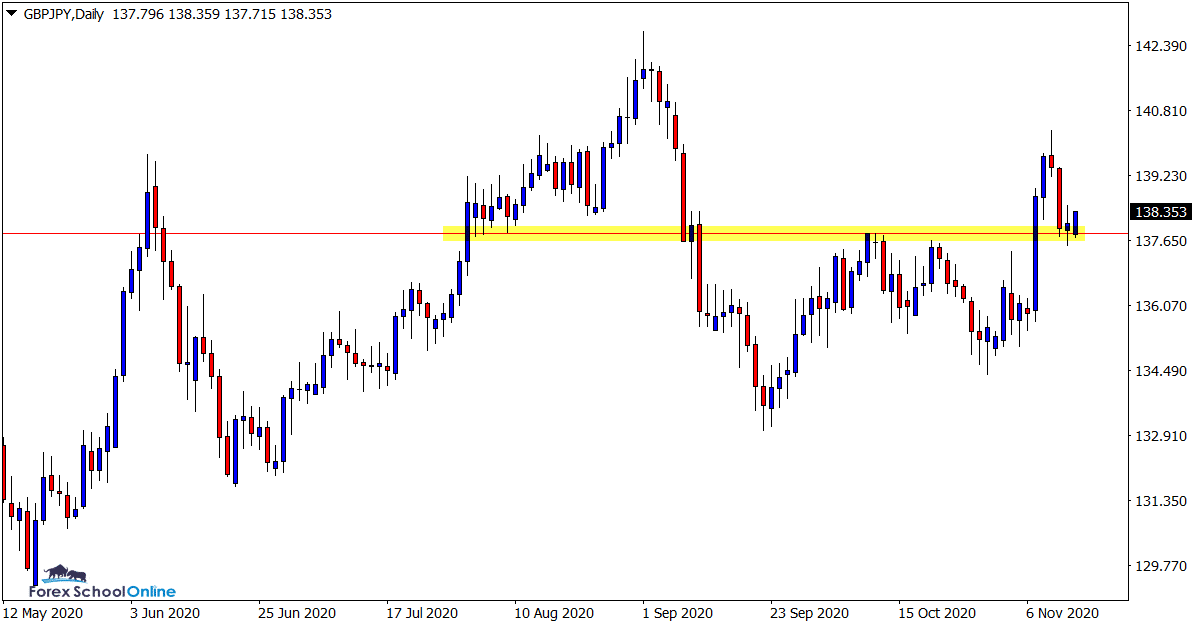
Weak Rejection of Support
Last week we were watching this pair as price reversed lower and moved back into the old daily resistance level.
Whilst price has now held at this level as a new price flip support level, the rejection has been fairly weak so far. We may have expected to see this level hold with a little stronger push back higher.
Whilst the strong rejection may come, so far we only have a small indecision candle at this support level.
With that in mind it could be best to watch this play out a little further until we see some more defined price action.
Daily Chart

EURNZD Daily Chart
-
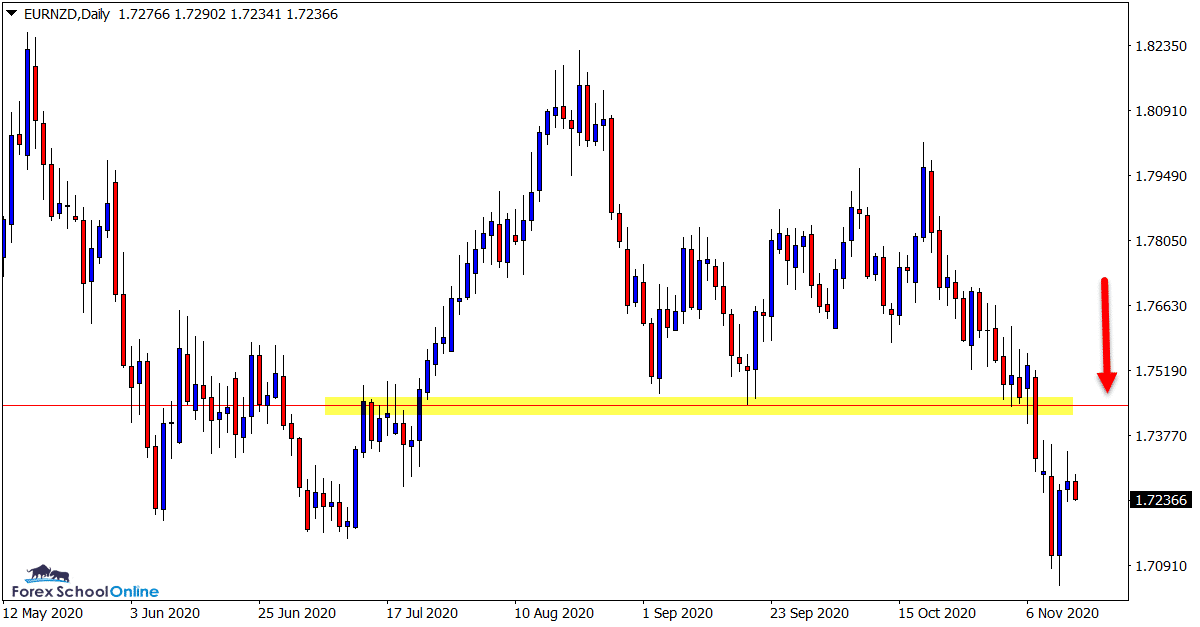
Watching Daily Resistance
After breaking through the key daily support level that had been holding price for the past few months, price has made a swift move lower.
As the daily chart shows, price is now looking to form a new trend lower.
If we can see the old breakout support level hold as a new price flip resistance, we could see a new lower high form and the start of a strong trend lower.
This new price flip resistance looks a key level in the coming sessions.
Daily Chart

NZDJPY Daily Chart
-
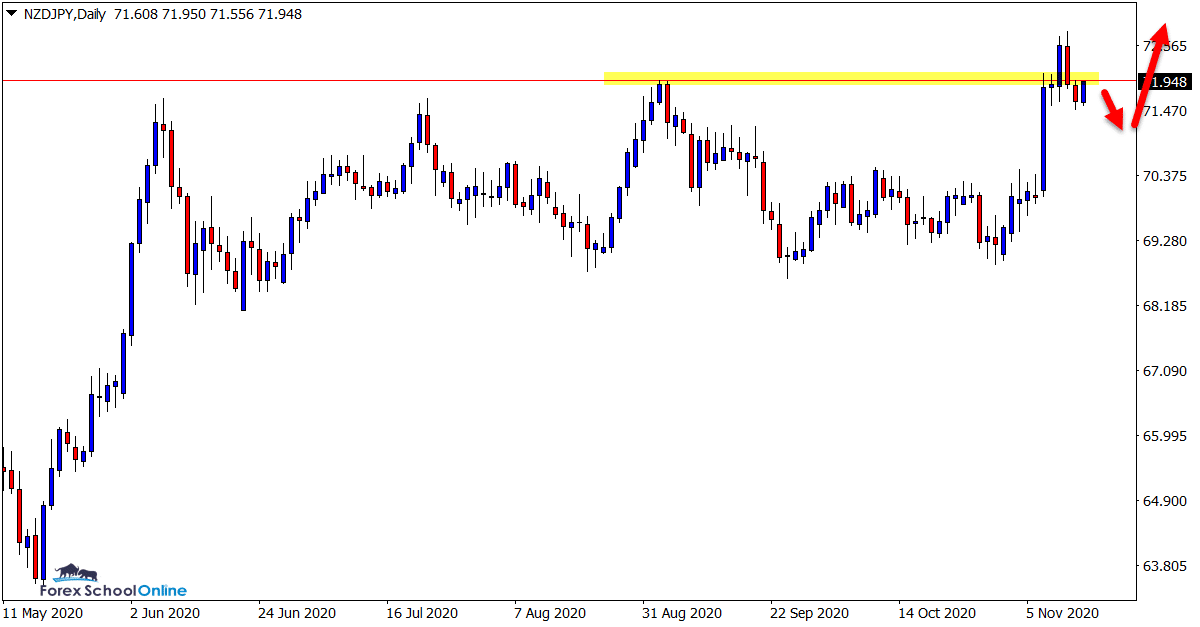
Can Price Breakout Higher?
As we discussed last week, price was testing the major daily resistance level.
Price has rejected that level and made a small move lower to finish last week below the resistance.
Momentum looks to be building for a breakout higher in this pair.
As the daily chart shows, if we can see a small bounce lower followed by another retest of the resistance, then we could start looking for breakout trades higher.
Daily Chart

US500 Daily Chart
-
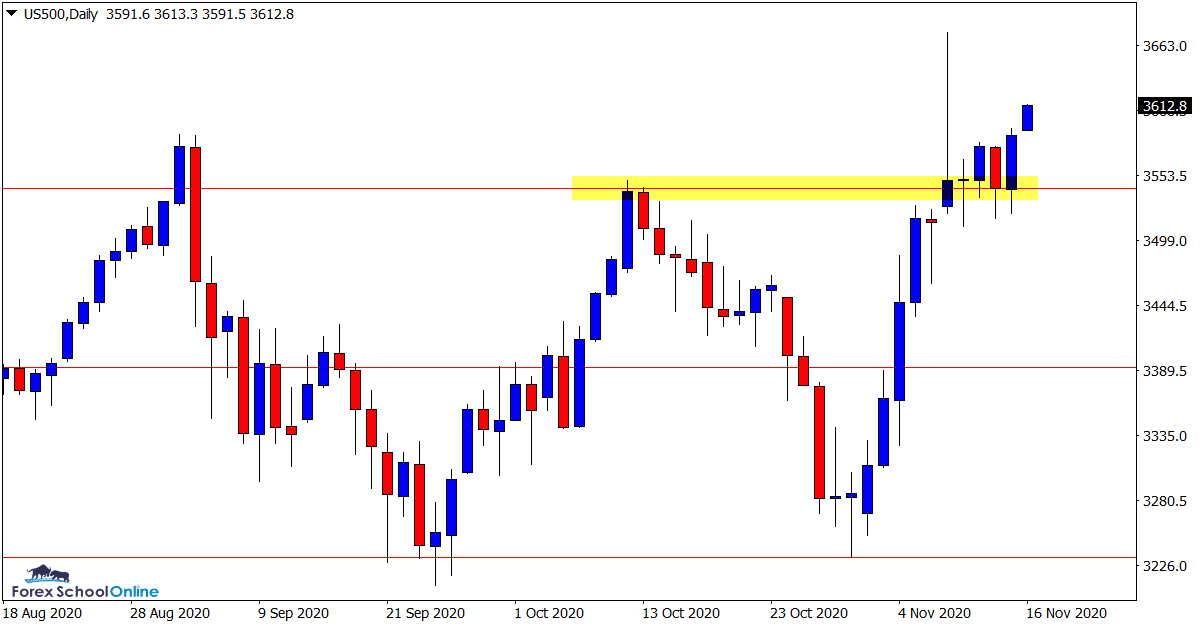
Daily Price Flip Holds
Last week this market formed a large bearish rejection candlestick.
The key to this bearish rejection however was that price could not move and importantly close back below the recent swing high and new support level.
This was telling because for all of the large sell off lower, the bulls still held their ground.
If this level continues to hold, then we can continue to look to trade with the momentum higher with new long trades.
Daily Chart

Trade Ideas Note: All views, discussions and posts in the ‘charts in focus trade ideas’ are the view of Forex School Online and are not recommendations or trading advice. All posts are general in nature and are not advice to buy or sell.
Note: We Use Correct ‘New York Close 5 Day Charts’ – You can read about why we use these and how to download the correct free charts at Correct Free New York Close Demo Charts
Please leave questions or comments in the comments section below;


Leave a Reply