Weekly Price Action Trade Ideas – 16th to 20th March 2020
Markets Discussed in This Week’s Trade Ideas: AUDNZD, EURGBP, GOLD and OIL.
Note: We Use Correct ‘New York Close 5 Day Charts’ – You can read about why we use these and how to download the correct free charts at Correct Free New York Close Demo Charts
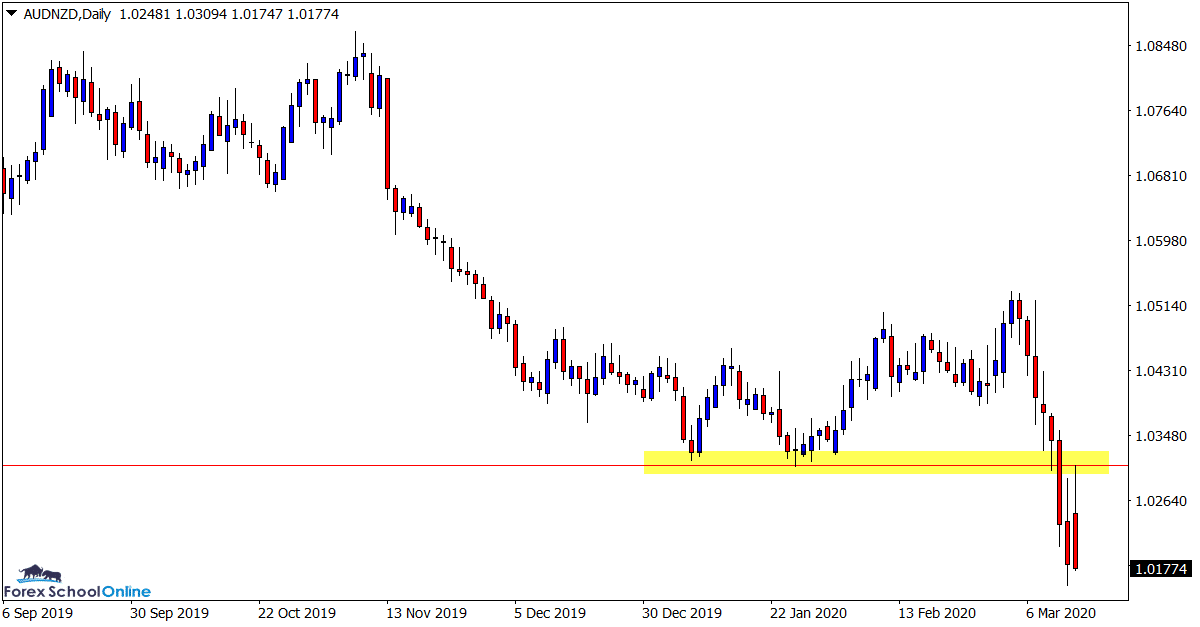
AUDNZD Daily Chart
Will Flip Level Hold for Larger Drop?
With mayhem and wild moves in the majority of Forex pairs and other markets, this pair in comparison has been ‘calm’.
Price has seen a large drop in the last two weeks, but compared to some of the other large and wild moves and whipsaws, this has been a clear move.
That could look to be tested this week.
If the resistance overhead continues to hold and the move lower gains momentum, there looks to be a large amount of space into the 1.0040 type area.
Daily Chart
EURGBP Daily Chart
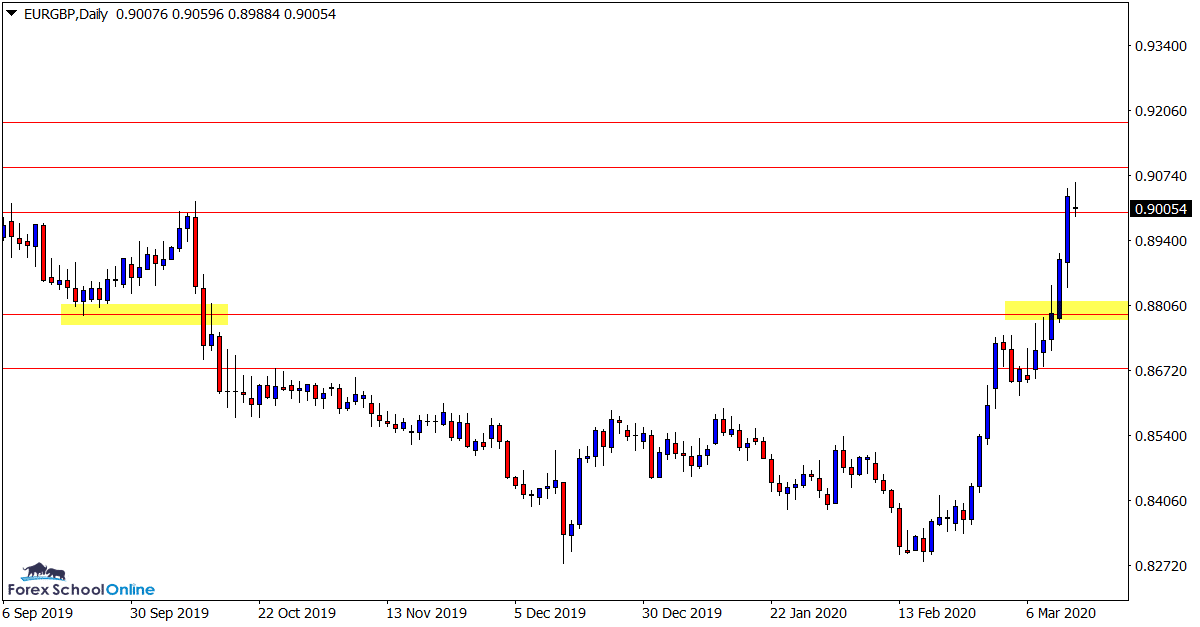
Support Holds for Bounce Higher
Last week we looked at this chart for a potential break higher and any long trades that could play out.
The follow through that had been present in other pairs also carried across to this market once price broke out higher and made a substantial close above the resistance level.
Now price is sitting on a minor support price flip. If this holds we could see continued pushes higher and new potential long trades to test the extreme resistance levels.
Daily Chart
GOLD Weekly and Daily Charts
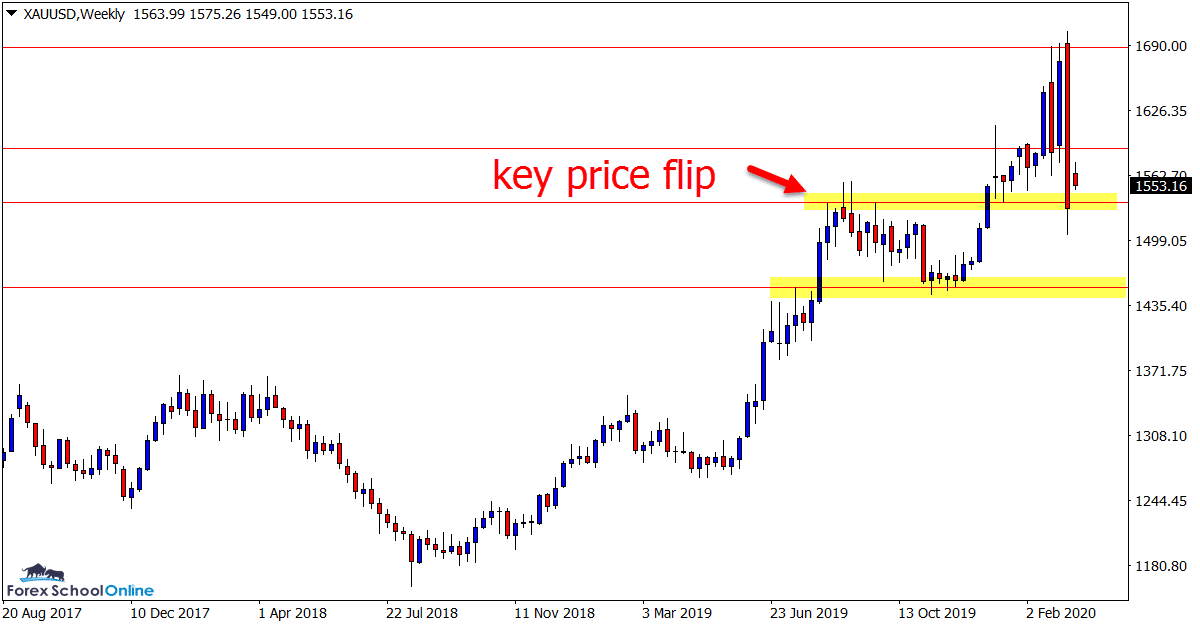
Weekly Engulfing Bar
This has been one of the most interesting markets of the lot. It is also one of the markets that has thrown many traders out of whack. Whereas Gold will often rise in times of uncertainty, this time it has been crunched lower just like many other world markets.
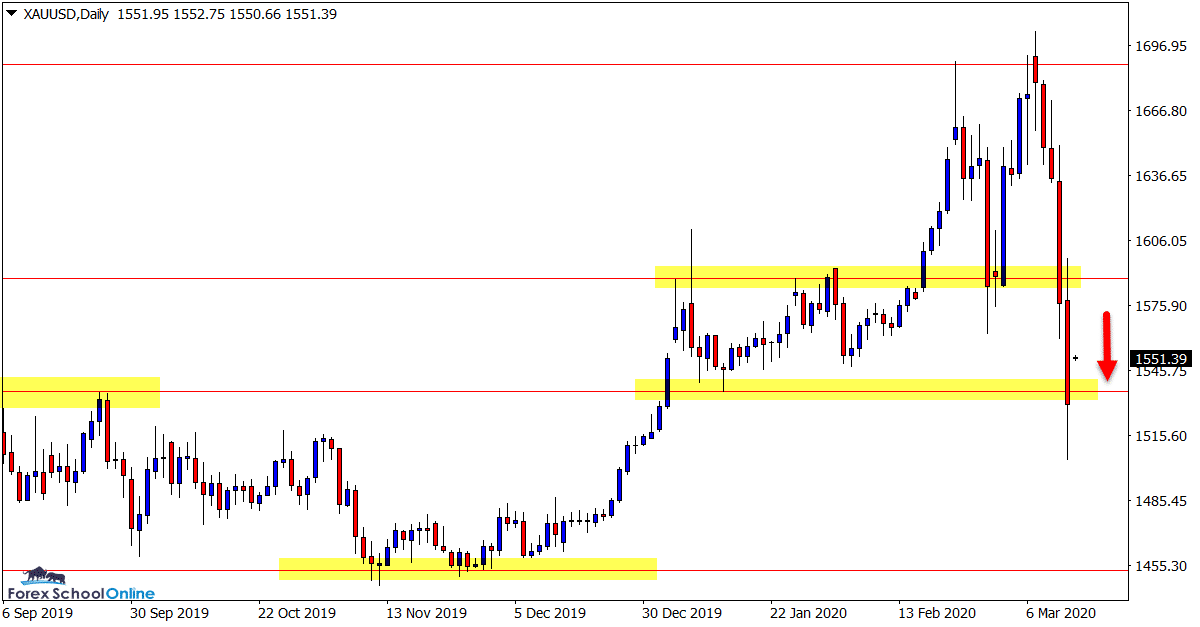
Last week we saw a large sell off that created a weekly bearish engulfing bar.
This engulfing bar sits just on top of a pretty important support level that is best illustrated by the daily chart (see below).
If this level breaks it could open the way for further fast moves lower and new potential short trades.
Weekly Chart
Daily Chart
OIL Daily Chart
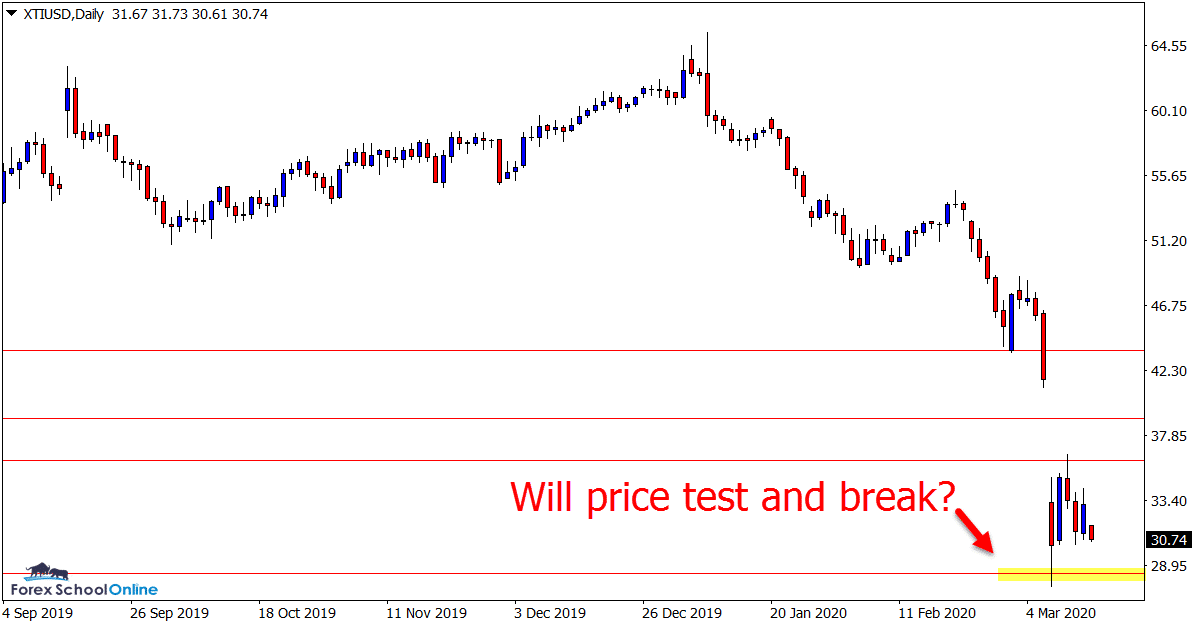
Daily Support Looks the Key
In last weeks trade ideas we were watching this market for a potential retest of the overhead resistance that price had smashed through with a large gap at the market opening.
Since rejecting the overhead resistance price has moved into a consolidation pattern and now sits between two important levels.
These levels look to be crucial in the coming sessions. If you zoom your daily chart out you will see the 28.40 looks to be key and any break below it could be of significance.
If the resistance breaks, then the gap could look to close and it could offer further potential bearish trade setups.
Daily Chart
Trade Ideas Note: All views, discussions and posts in the ‘charts in focus trade ideas’ are the view of Forex School Online and are not recommendations or trading advice. All posts are general in nature and are not advice to buy or sell.
Note: We Use Correct ‘New York Close 5 Day Charts’ – You can read about why we use these and how to download the correct free charts at Correct Free New York Close Demo Charts
Please leave questions or comments in the comments section below;


Hi I am a non Aussie resident, can your recommendation of broker accept. I would like regulated broker by ASIC that can go for 1:100 & with ECN.
Do you think it is possible?