Weekly Price Action Trade Ideas – 16th to 20th Dec 2019
Markets Discussed in This Week’s Trade Ideas: EURGBP, USDCAD, AUDSGD and GOLD.
Note: We Use Correct ‘New York Close 5 Day Charts’ – You can read about why we use these and how to download the correct free charts at Correct Free New York Close Demo Charts
EURGBP Daily and 4 Hour Charts
Break and Test Pattern
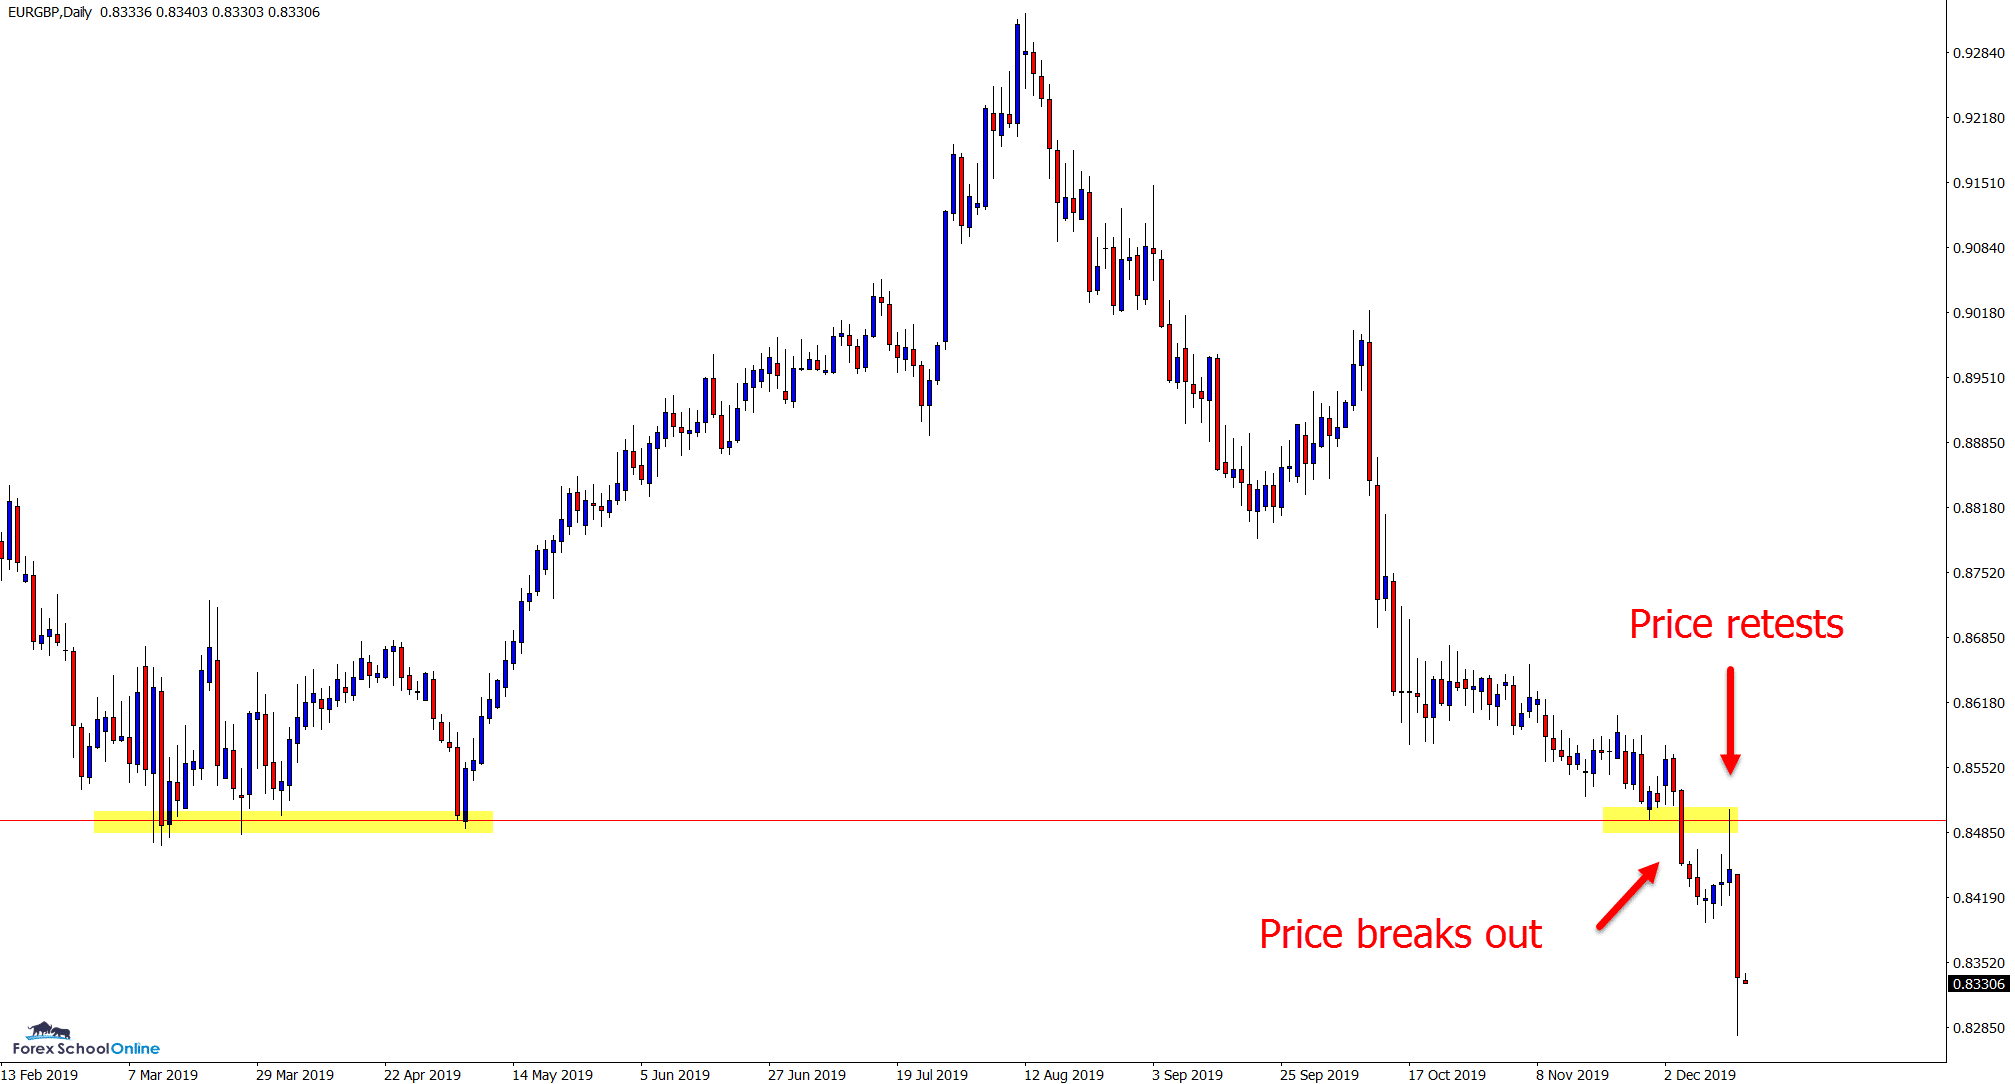
This is a pair that we have been watching and waiting for a clear and decisive move from. In previous breakouts in recent times the follow through has had little momentum.
This changed last week and we finally got some free flowing price action and a clear break lower.
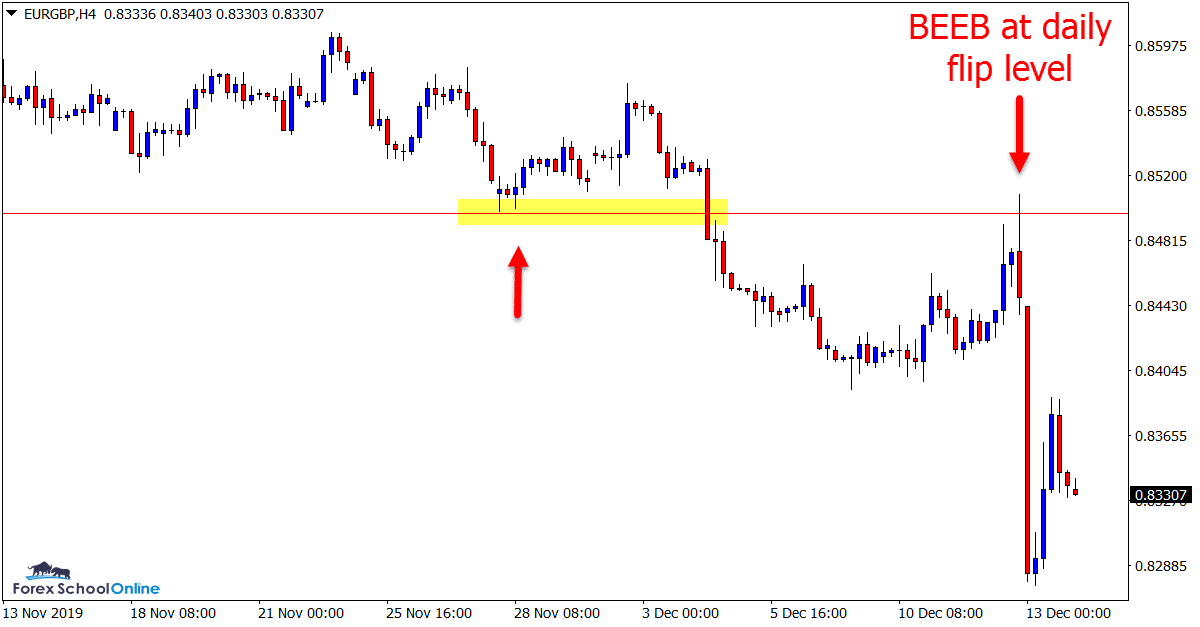
Traders who missed the initial break lower were also presented with a pretty textbook breakout and intraday retest trade setup with price rotating back into the old support and new resistance to fire off a 4 hour engulfing bar.
This same pattern could potentially form again this week should price rotate higher and back into the close overhead resistance level around 0.8395.
Daily Chart
4 Hour Chart
AUDSGD Daily and 4 Hour Charts
Huge False Break Pin Bar
We have been charting and watching this pair quite a bit in the last few weeks trade ideas as it has made a solid move lower.
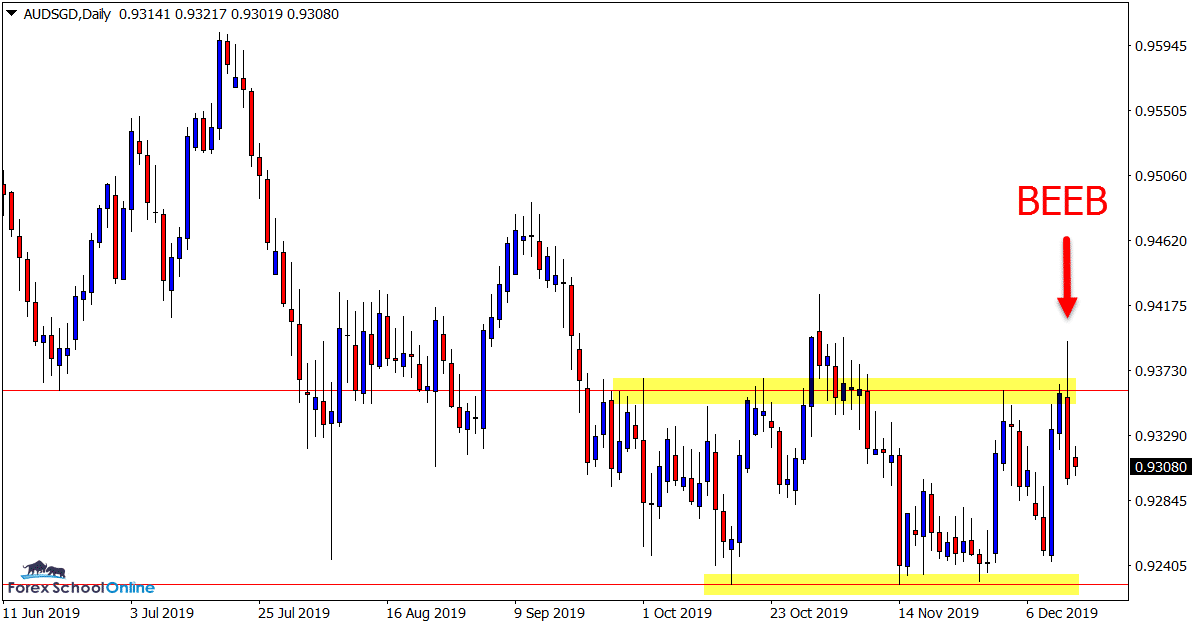
Price as yet has been unable to break through the daily chart support and it has been rotating between the major support and resistance levels.
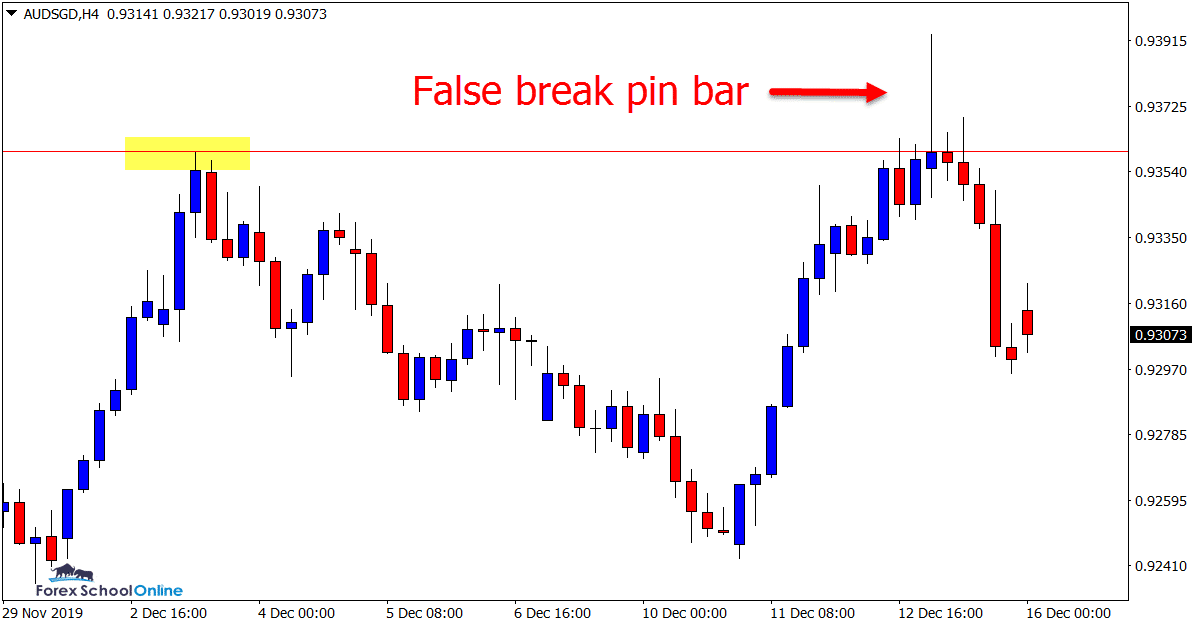
During the past week we saw price make another test of both these levels with price rejecting the resistance with a huge 4 hour chart false break pin bar and a daily chart engulfing bar.
Until this consolidation breaks, both of these levels look like solid levels to hunt potential trade setups.
Daily Chart
4 Hour Chart
USDCAD Daily Chart
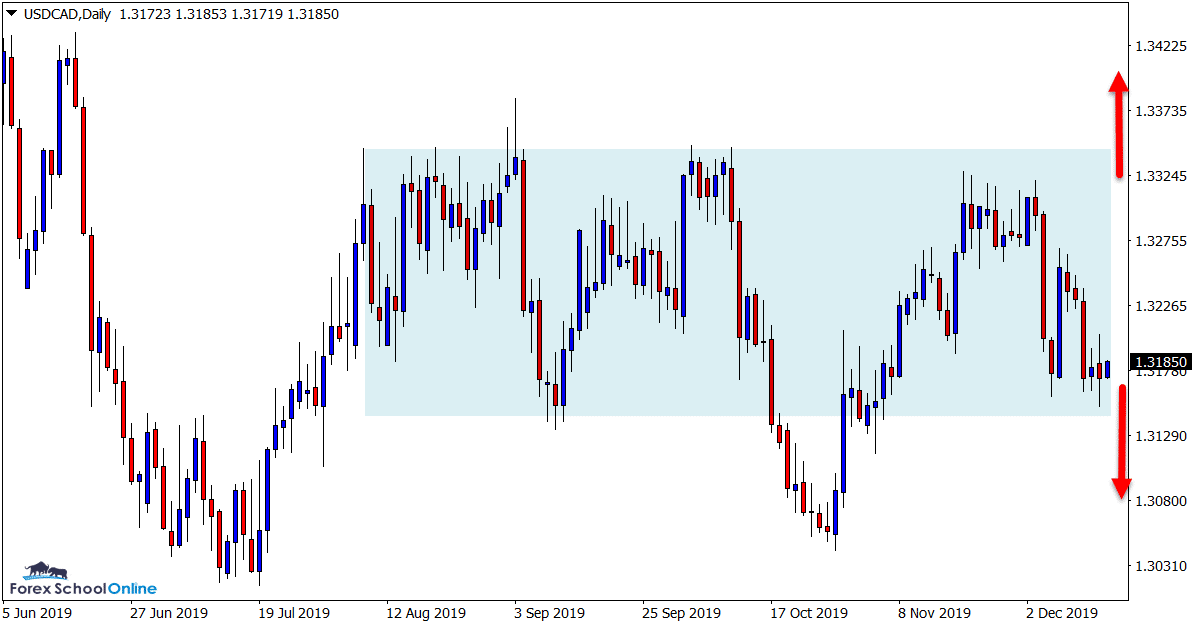
Incredibly Sideways Price Action
This pair is typical of what we have been seeing in a lot of pairs in the back half of this year.
As the chart shows below; price has no clear direction higher or lower and is a big blob of price chopping up and down.
These markets are incredibly tricky to find high probability trades in and the best play is often to look to other pairs.
Daily Charts
GOLD Daily Chart
Watching the Daily Levels
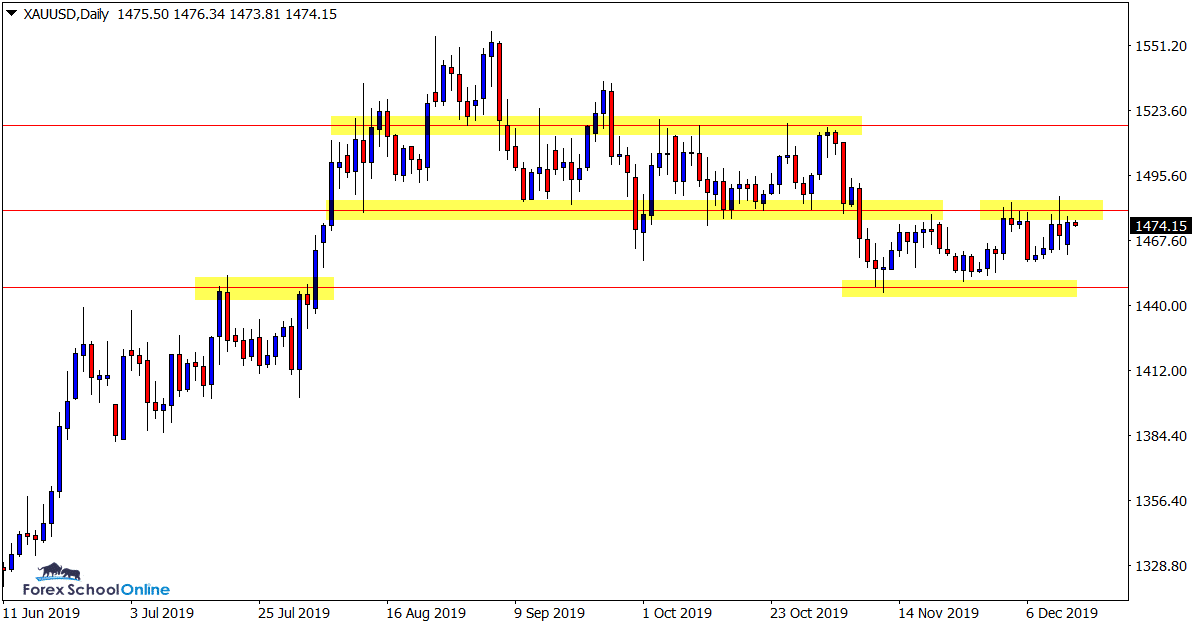
This is another tricky market that has not made a substantial move in the last three months.
The one positive that this market has going for it is that it has been respecting its daily chart support and resistance levels as shown on the chart below.
These levels could be used to find potential intraday trades until we get a clear breakout and a better indication of the next major move for this market.
Daily Chart
Trade Ideas Note: All views, discussions and posts in the ‘charts in focus trade ideas’ are the view of Forex School Online and are not recommendations or trading advice. All posts are general in nature and are not advice to buy or sell.
Note: We Use Correct ‘New York Close 5 Day Charts’ – You can read about why we use these and how to download the correct free charts at Correct Free New York Close Demo Charts
Please leave questions or comments in the comments section below;


Leave a Reply