Weekly Price Action Trade Ideas – 14th to 18th Dec 2020
Markets Discussed in This Week’s Trade Ideas: EURJPY, AUDCAD, GBPAUD and USDX.
Note: We Use Correct ‘New York Close 5 Day Charts’ – You can read about why we use these and how to download the correct free charts at Correct Free New York Close Demo Charts
EURJPY Daily Chart
-
Momentum Building For Breakout
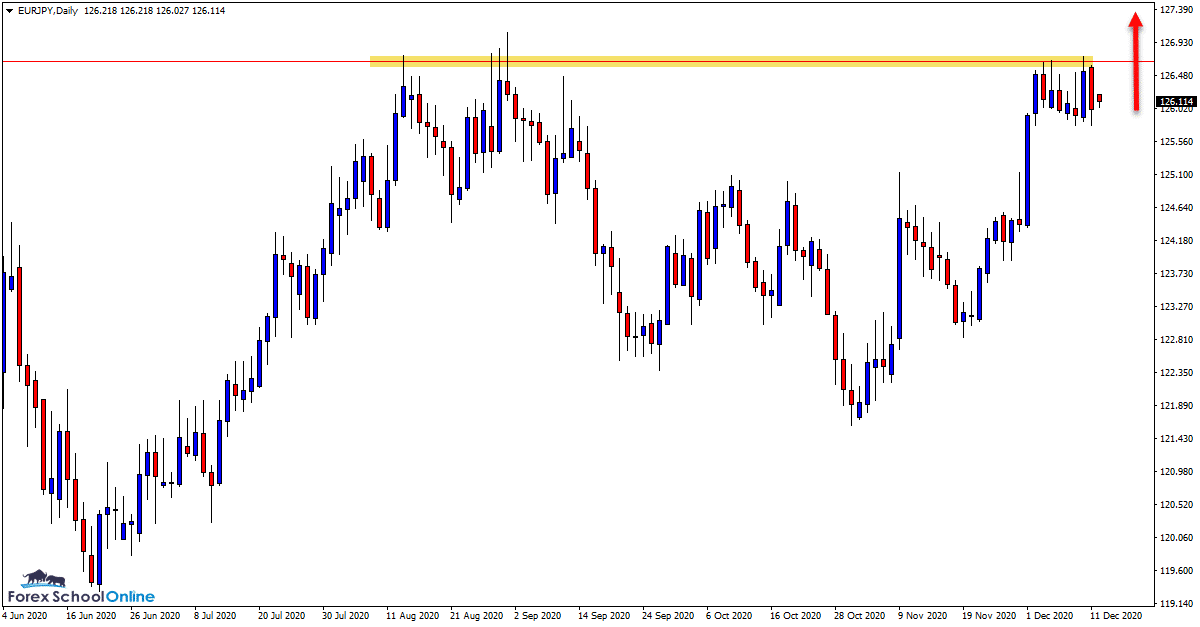
I am now watching this pair closely for a potential breakout higher.
As the daily chart shows, price is sitting just below the major daily chart resistance level. This has been a major level in recent times on this pair.
In more recent times we can see price has moved into a tight sideways box pattern just below this level.
If price can now make a move above this box and resistance, then we can start to look for long breakout trades.
Daily Chart

AUDCAD Daily Chart
-
Key Daily Resistance Coming Into Play
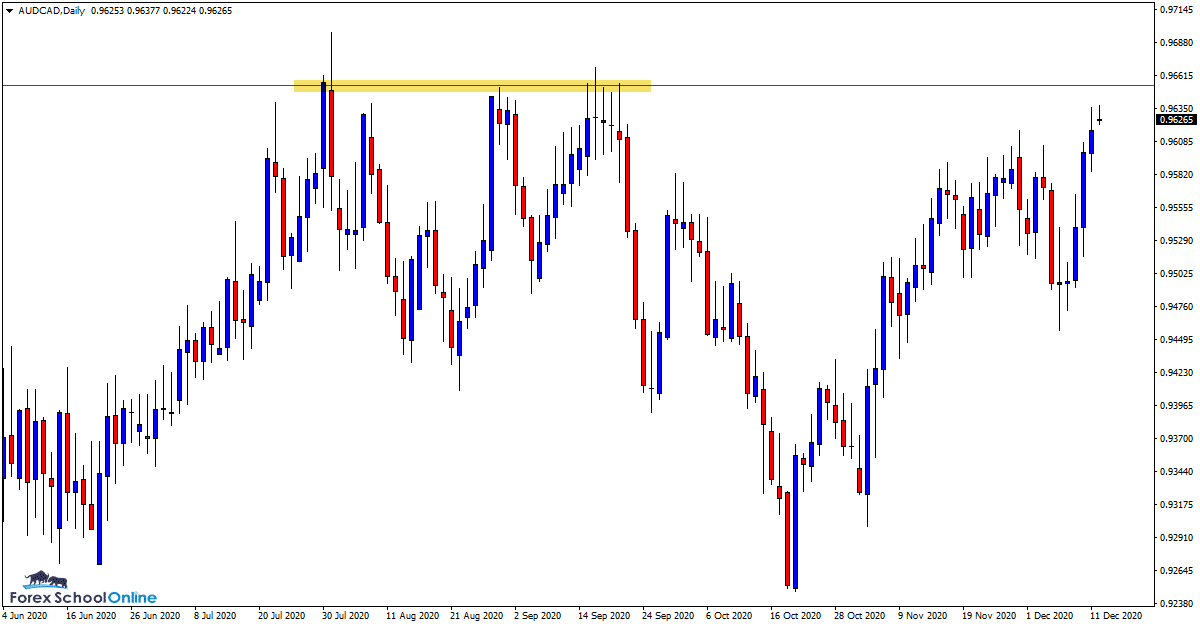
Price on the daily chart of this pair is making a strong move higher.
Just overhead we can see that a strong daily chart resistance is about to come into play.
Very agressive traders could be watching this level for potential counter-trend trades and for price to reject this level with a snap back lower.
More conservative traders could be looking to trade inline with the recent momentum higher and waiting for any pullbacks lower to get long.
Daily Chart

GBPAUD Daily Chart
-
Watching for Pullback Into Resistance
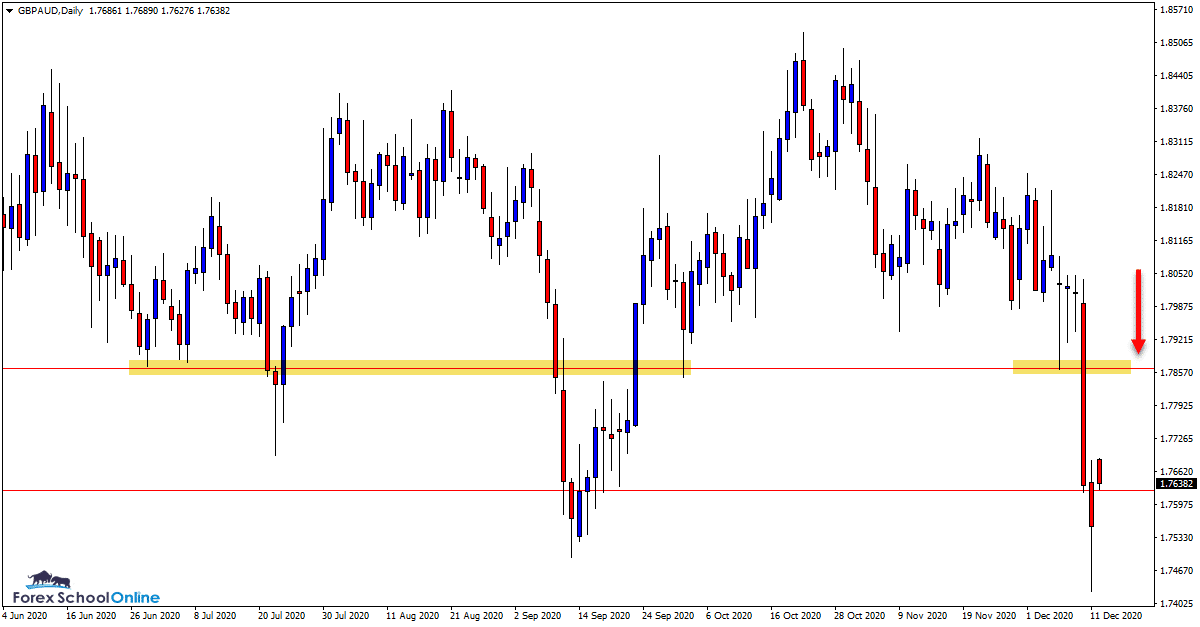
Price on this pair made a very strong break lower last week through the daily char support level.
As the daily chart shows, this support level could now flip and look to become a new resistance level.
If we can see price rotate higher and back into this level, then we can start to look for new short trades.
Short trades could be hunted on both the daily and intraday time frames at this key level.
Daily Chart

USDX Daily Chart
-
Will the Downtrend Continue?
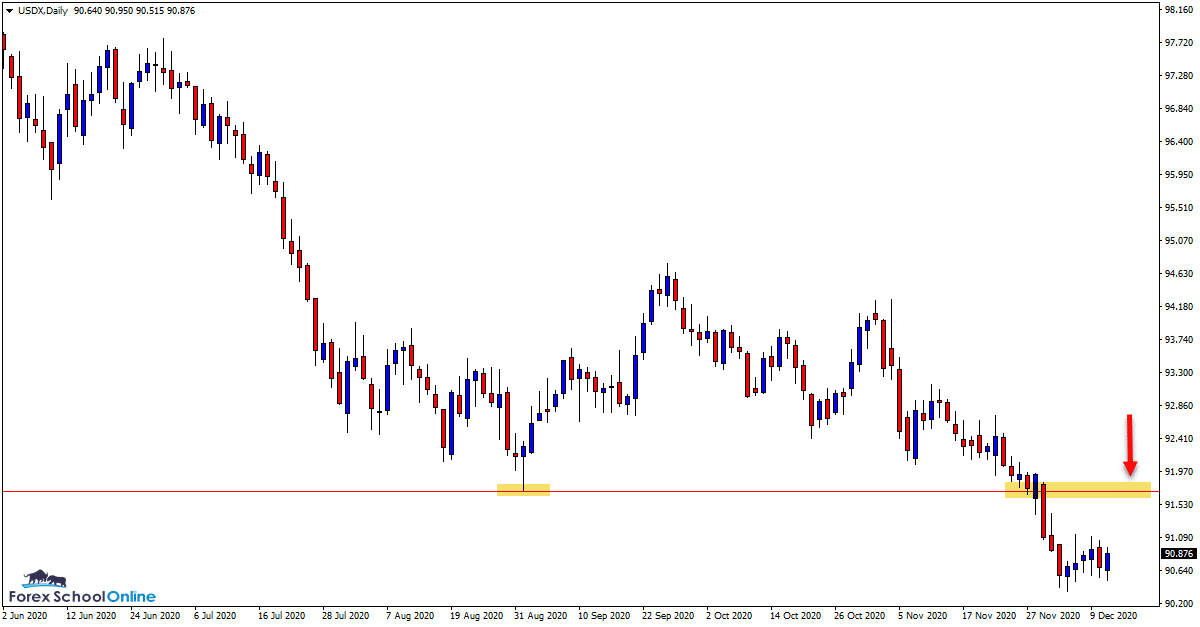
This market is in a fairly clear cut trend lower on the higher time frames and looking to trade inline with this momentum looks the best play.
If we can see price make a pullback higher and into a value area, then we can start to look for new short trades.
There is an overhead level that recently held as support that could now act as a high probability level to look for short trades. This new price flip resistance could be a solid level to look for A+ bearish price action signals to get short.
Daily Chart

Trade Ideas Note: All views, discussions and posts in the ‘charts in focus trade ideas’ are the view of Forex School Online and are not recommendations or trading advice. All posts are general in nature and are not advice to buy or sell.
Note: We Use Correct ‘New York Close 5 Day Charts’ – You can read about why we use these and how to download the correct free charts at Correct Free New York Close Demo Charts
Please leave questions or comments in the comments section below;


Leave a Reply