Weekly Price Action Trade Ideas – 14th April 2020
Markets Discussed in This Week’s Trade Ideas: AUDUSD, GBPCHF, AUDSGD and GOLD.
Note: We Use Correct ‘New York Close 5 Day Charts’ – You can read about why we use these and how to download the correct free charts at Correct Free New York Close Demo Charts
AUDUSD Weekly and Daily Charts
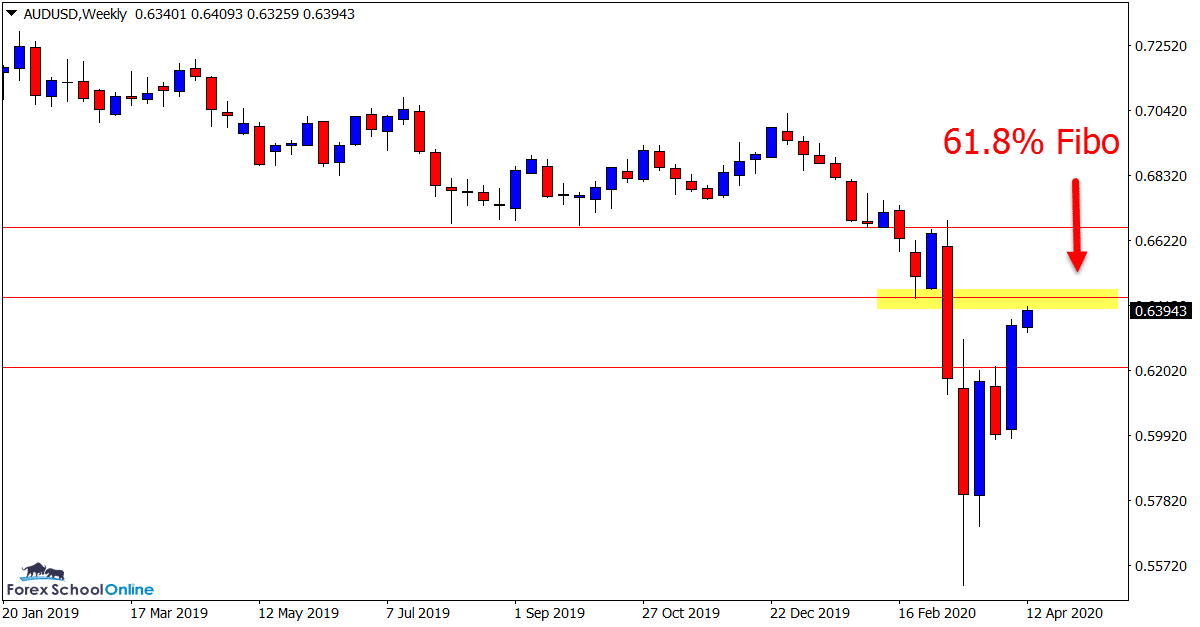
61.8% Fibo Level Coming Into Play
It has been a wild ride for the AUDUSD.
After being smashed lower from the December highs, price has made a solid comeback.
If you plot a Fibonacci tool on your weekly chart from the extreme high to the extreme swing low you will see price is now moving into the 61.8% fibo level.
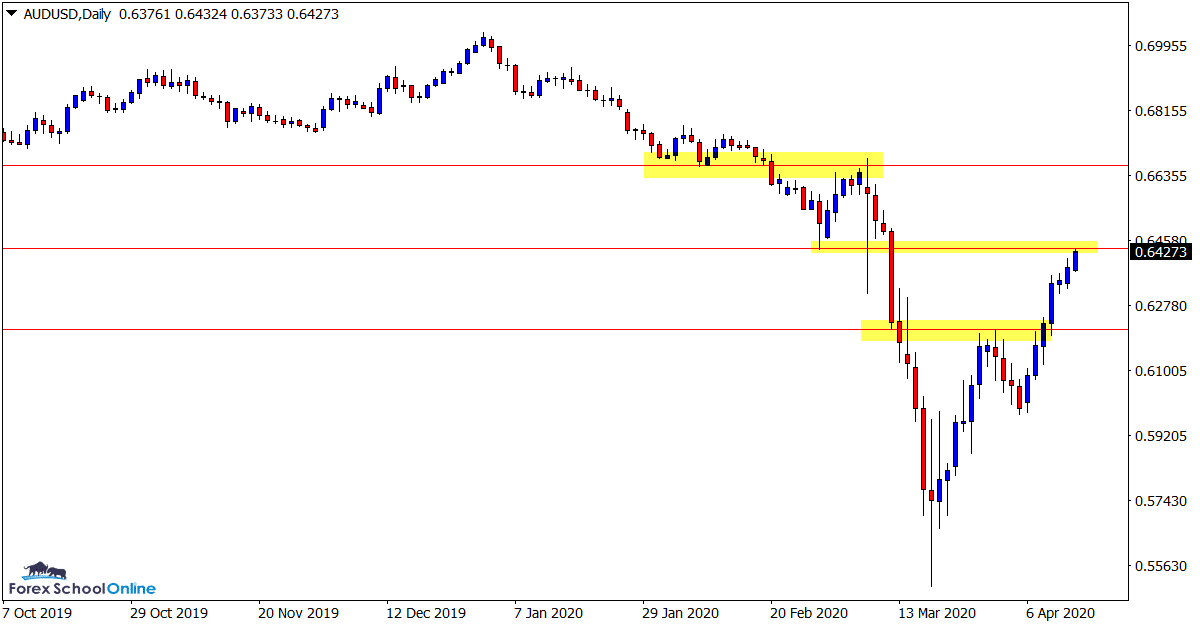
This level also lines up with the most recent area price found support.
This level looks an important area to watch in the next few sessions. A break above and the momentum would look to continue with a lot more space to continue moving into.
However; if the old support holds as a new resistance, then the short selling could resume and there is a lot of room for price to fall into.
Weekly Chart
Daily Chart
GBPCHF Weekly and Daily Charts
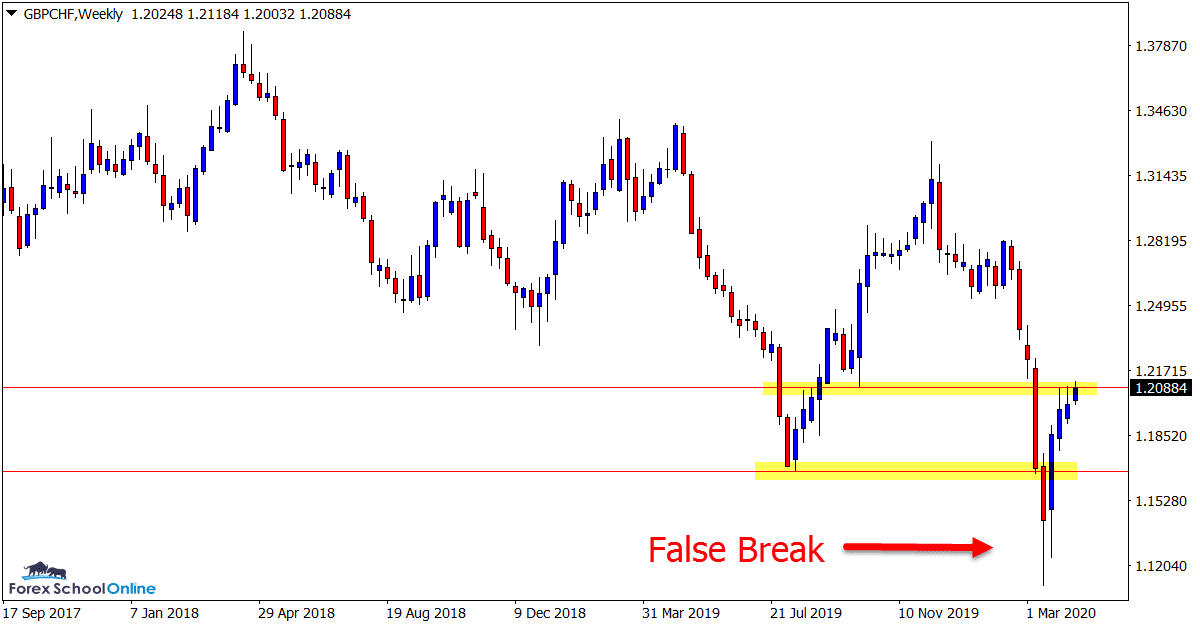
Weekly False Break Sparks Push Higher
After trying to make a sustained break lower and through the recent swing low, price quickly snapped back higher and formed a large false break.
As the weekly chart shows below; this was a clean false break that sent price rocketing back higher.
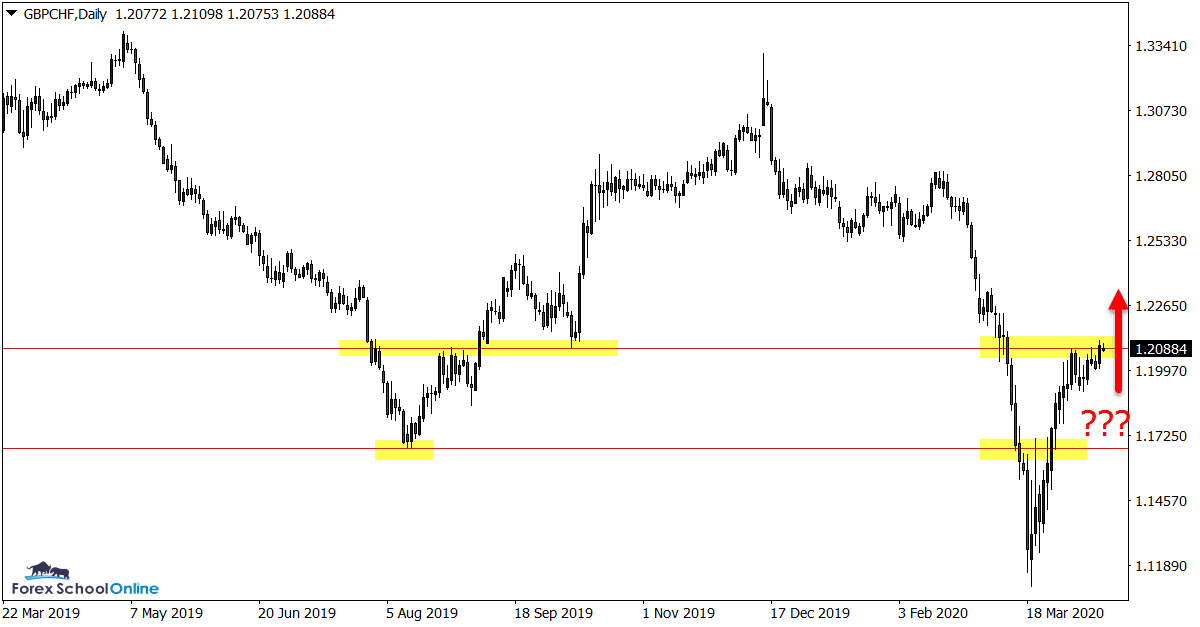
On the daily chart price now sits at an interesting level.
This level has been a proven support and resistance level.
If we can get a solid break above, then it could pave the way for long trades inline with the recent momentum. These setups could be breakouts or quick breakout and intraday retest trade setups.
Weekly Chart
Daily Chart
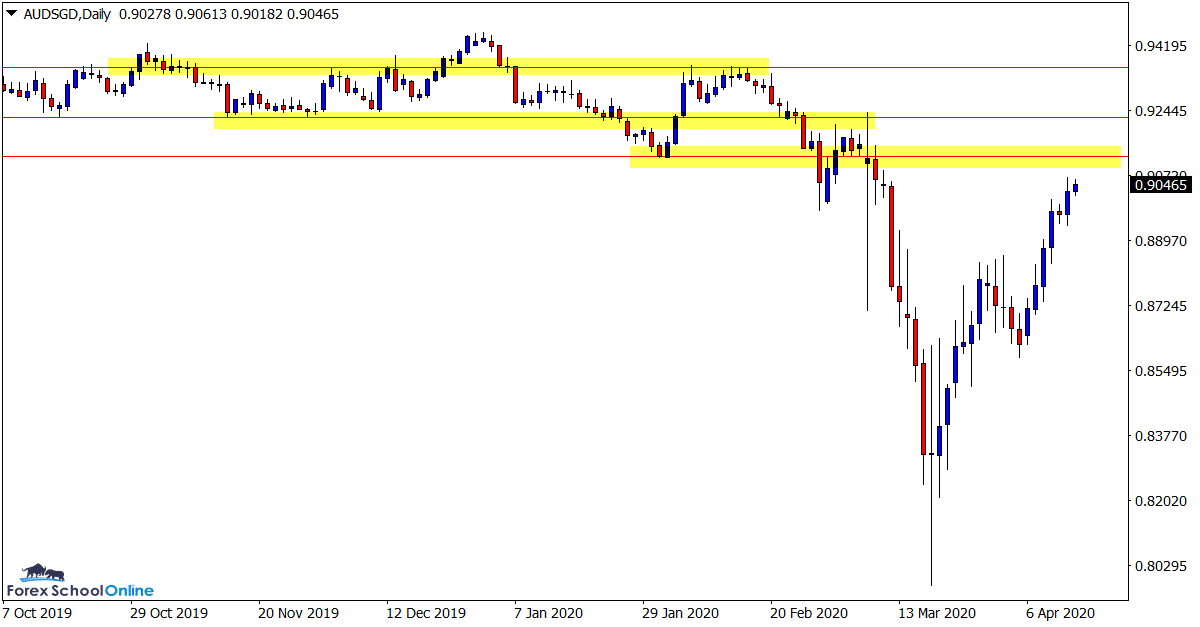
AUDSGD Daily Chart
Test of Resistance Coming
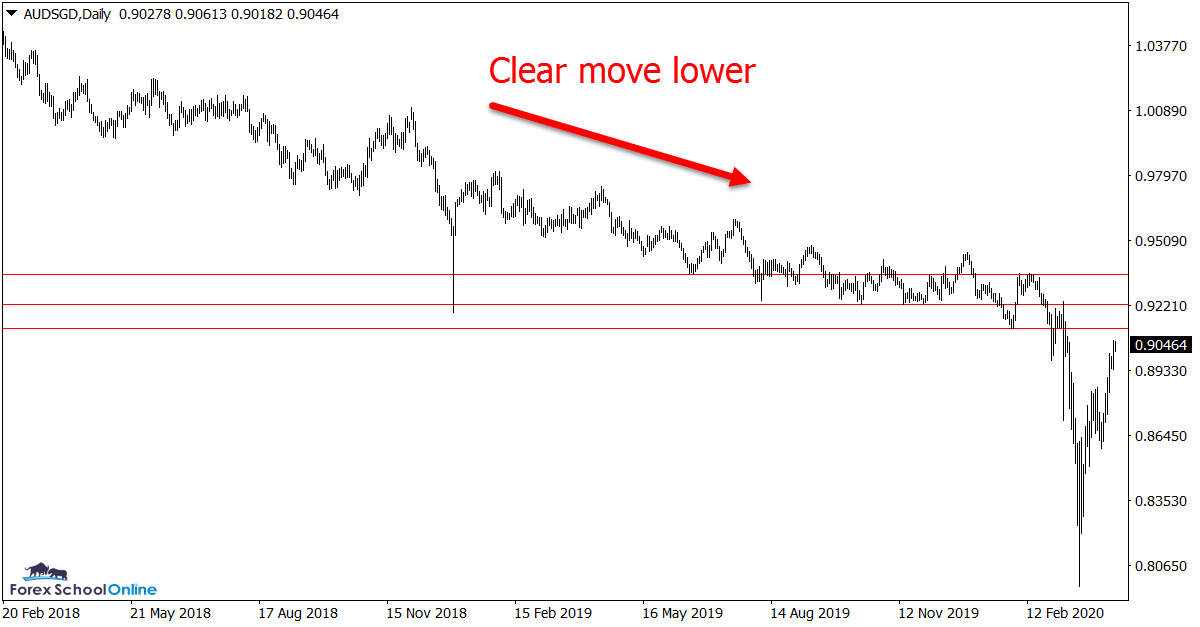
Before the markets started feeling the affects of Covid-19, the AUDSGD was already gradually moving lower with a series of lower highs and lower lows.
This was then quickly accelerated and price was hammered lower through major support levels.
Just like the AUDUSD this market has since retraced back higher to recover some of the losses.
Price has been able to freewheel back higher because after the huge sell off there were not many resistance levels for it to encounter. This allowed price to move freely without any trouble to run into.
This looks to potentially change in the coming sessions.
Even if price breaks the first resistance, a second and then third come in quick succession.
Daily Chart
Daily Chart
GOLD Daily Chart
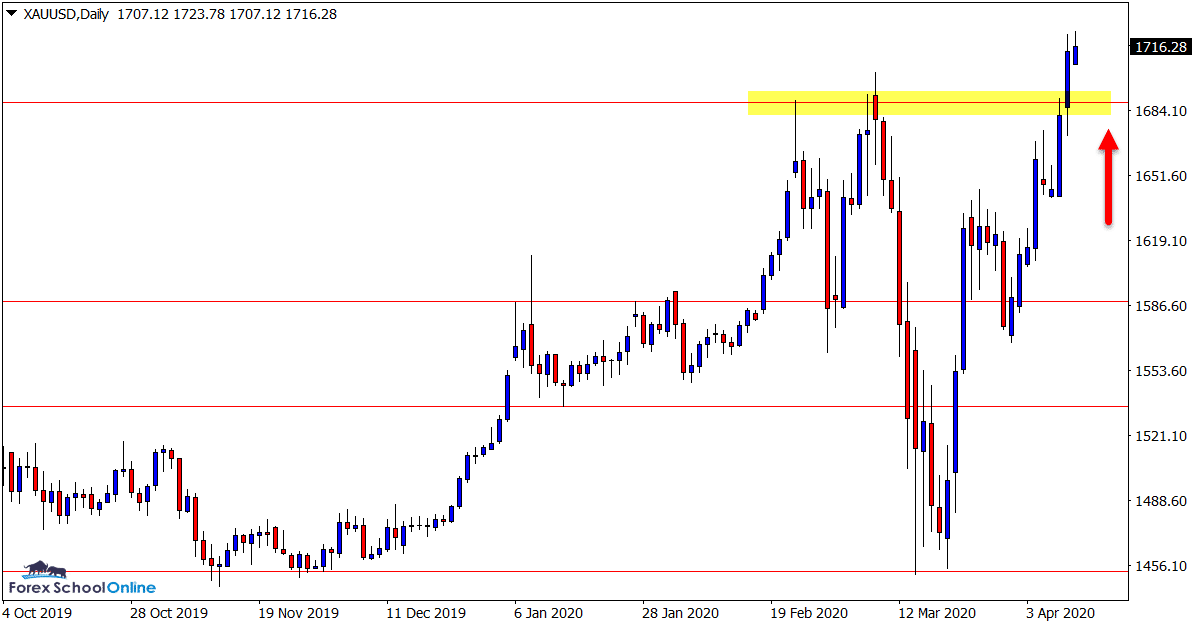
New Support Price Flip For Large Push Higher?
After not being able to break the major support level around 1452.90, price has rebounded and moved into the extreme high of the recent range.
Price is now looking to breakout of this box type area and if it can do so successfully it could make further quick moves into the next resistance level around the 1788.80 type area.
If the breakout level area holds as a new support it could pave the way for a lot of new potential long trade opportunities to keep an eye open for.
Daily Chart
4 hour Chart

Trade Ideas Note: All views, discussions and posts in the ‘charts in focus trade ideas’ are the view of Forex School Online and are not recommendations or trading advice. All posts are general in nature and are not advice to buy or sell.
Note: We Use Correct ‘New York Close 5 Day Charts’ – You can read about why we use these and how to download the correct free charts at Correct Free New York Close Demo Charts
Please leave questions or comments in the comments section below;


Apt! Very simple but professional analysis.
Thanks!