Weekly Price Action Trade Ideas – 12th to 16th Oct 2020
Markets Discussed in This Week’s Trade Ideas: AUDUSD, CADJPY, SILVER and AUS200.
Note: We Use Correct ‘New York Close 5 Day Charts’ – You can read about why we use these and how to download the correct free charts at Correct Free New York Close Demo Charts
AUDUSD Daily Chart
-
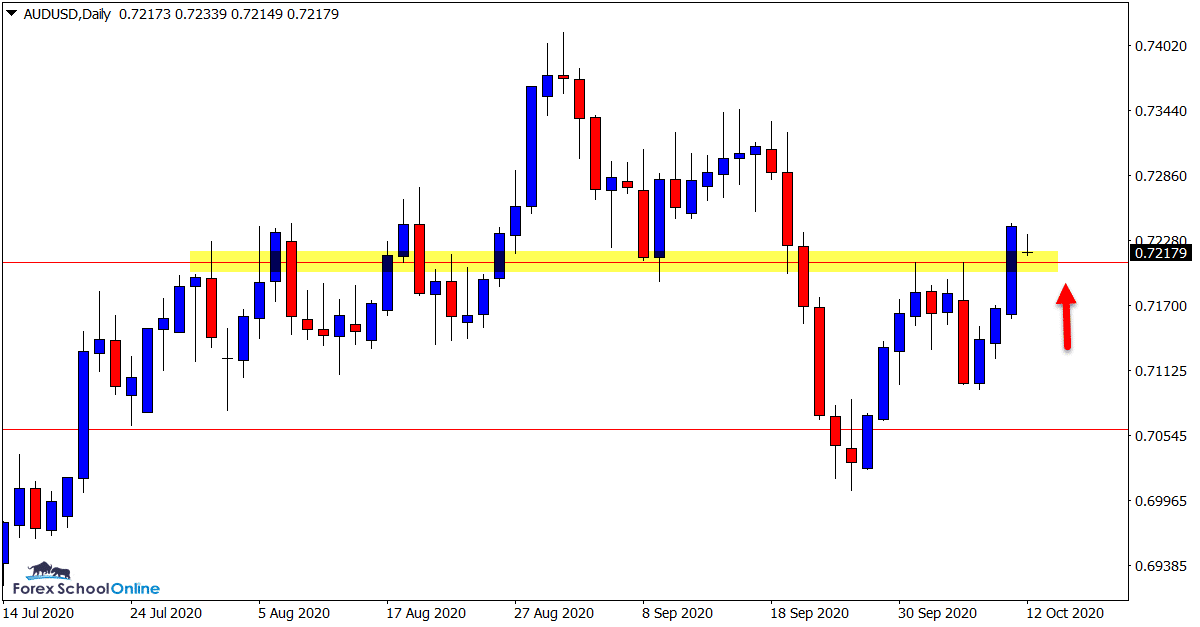
Price Flip Support in Play
Price on the daily chart of the AUDUSD is now trying to continue the long running trend higher it has been making since March this year.
After breaking lower with a 1,2,3 reversal pattern, price has since bounced back and is now back above the important price flip level.
This level has in recent times held as both a key support and resistance level.
If it holds now it could be a solid level to watch for intraday bullish trades for price to continue the march back into the next swing high resistance.
Daily Chart

CADJPY Daily Chart
-
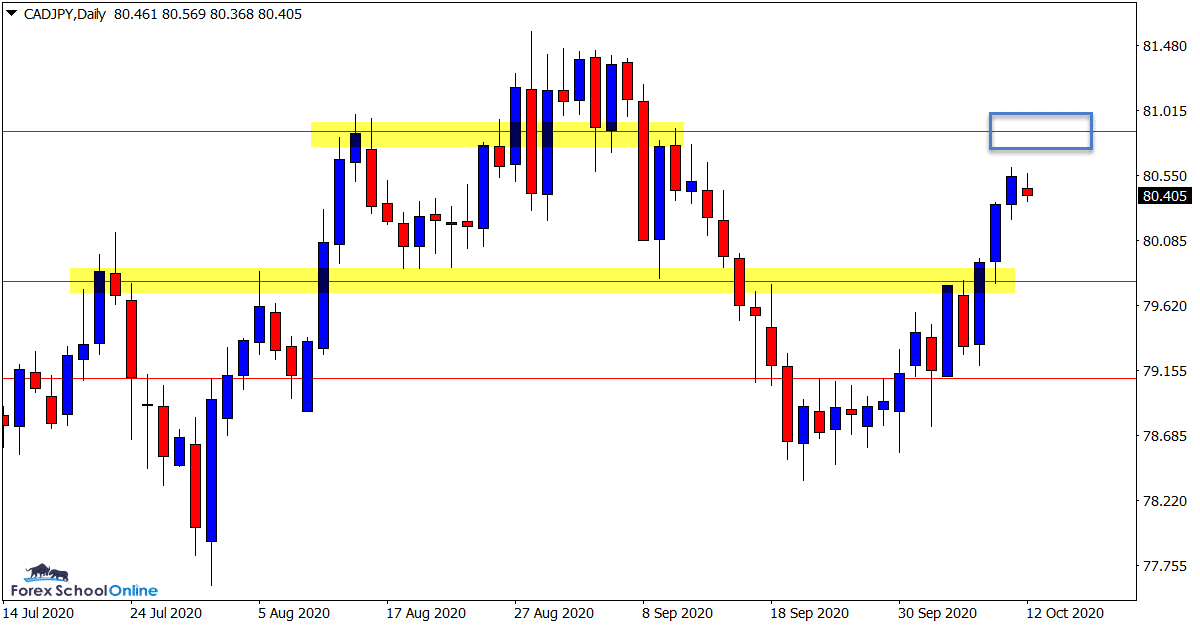
Price Moving Into Daily Resistance Level
Whilst we have been in a ranging market in the last few months with this pair, price is currently making a solid swing higher.
This move looks like it is heading into the important daily resistance level around 80.86.
Even though we have seen a strong move higher, this market is still sideways and this level could be a solid potential area to look for short trades.
Until we get a clear break and a new trend forms, we can continue to look to play both sides of the market.
Daily Chart

SILVER Daily Chart
-
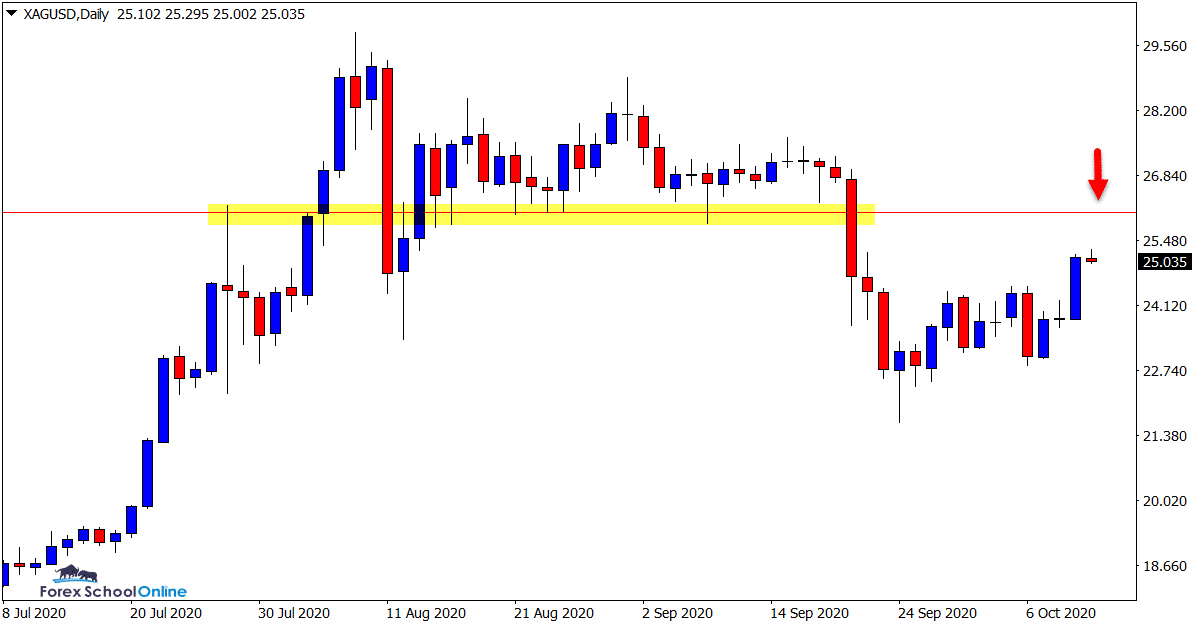
Sideways Range Continuing
This is an interesting market and a market where caution is probably best.
Whilst it is pretty clear we have a range and sideways move in play, there are a lot of traps and false moves occurring within it.
This means that whilst price may respect a support or resistance, it is making a false break higher or lower first.
The other reason caution may be best is because we have signs of momentum to the upside with a bottom pattern on the daily chart, but price is running directly into the major resistance level.
It could be best to watch this level for the next price action clue.
Daily Chart

AUS200 Daily Chart
-
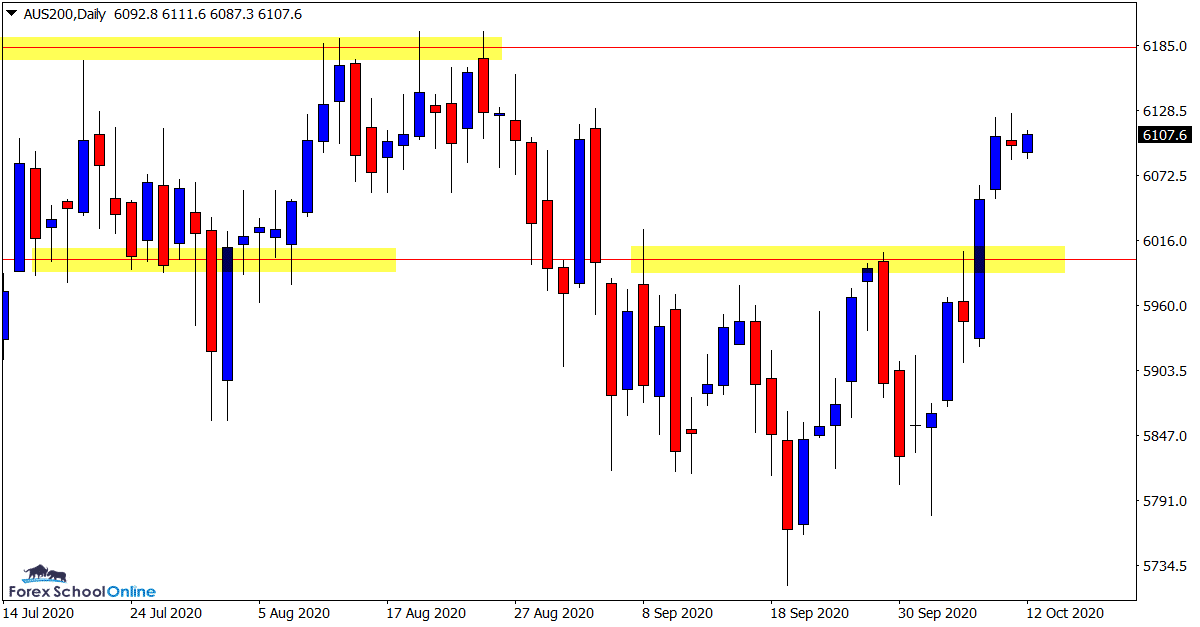
Can Price Form Fresh Highs?
This market is now making a strong move higher into the important daily resistance level.
Whilst we could expect to see some resistance at this level, if price breaks it, then it could open the door to a much larger move higher.
This level is pretty significant because if it breaks, then it would see price move into a new six monthly high. This level is also almost bang on the 61% Fibonacci retracement point from when price started selling off at the start of the year.
This presents as a major watch in the coming sessions.
Daily Chart

Trade Ideas Note: All views, discussions and posts in the ‘charts in focus trade ideas’ are the view of Forex School Online and are not recommendations or trading advice. All posts are general in nature and are not advice to buy or sell.
Note: We Use Correct ‘New York Close 5 Day Charts’ – You can read about why we use these and how to download the correct free charts at Correct Free New York Close Demo Charts
Please leave questions or comments in the comments section below;


Leave a Reply