Weekly Price Action Trade Ideas – 11th June
Markets Discussed in This Week’s Trade Ideas: AUDCAD, NZDJPY, USDSGD and OIL v USD.
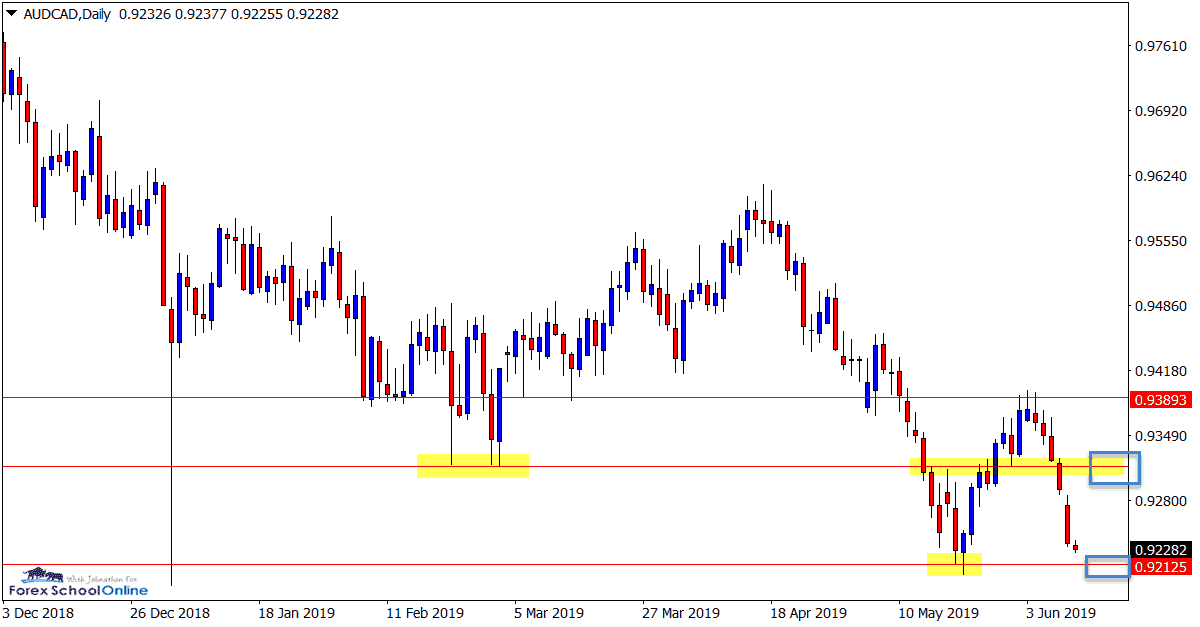
AUDCAD Daily Chart
Moving Into Daily Support
Price on the daily chart of the AUDCAD has been sliding lower in recent times. As the daily chart shows below; price is now creeping lower into the major daily support level that has recently held as a swing low.
Whilst the very short-term momentum has been lower, on the daily chart price overall has been sideways with no clear trend in either direction.
This level could prove crucial and a solid level to watch for potential bullish A+ price action trigger signals.
Daily Chart
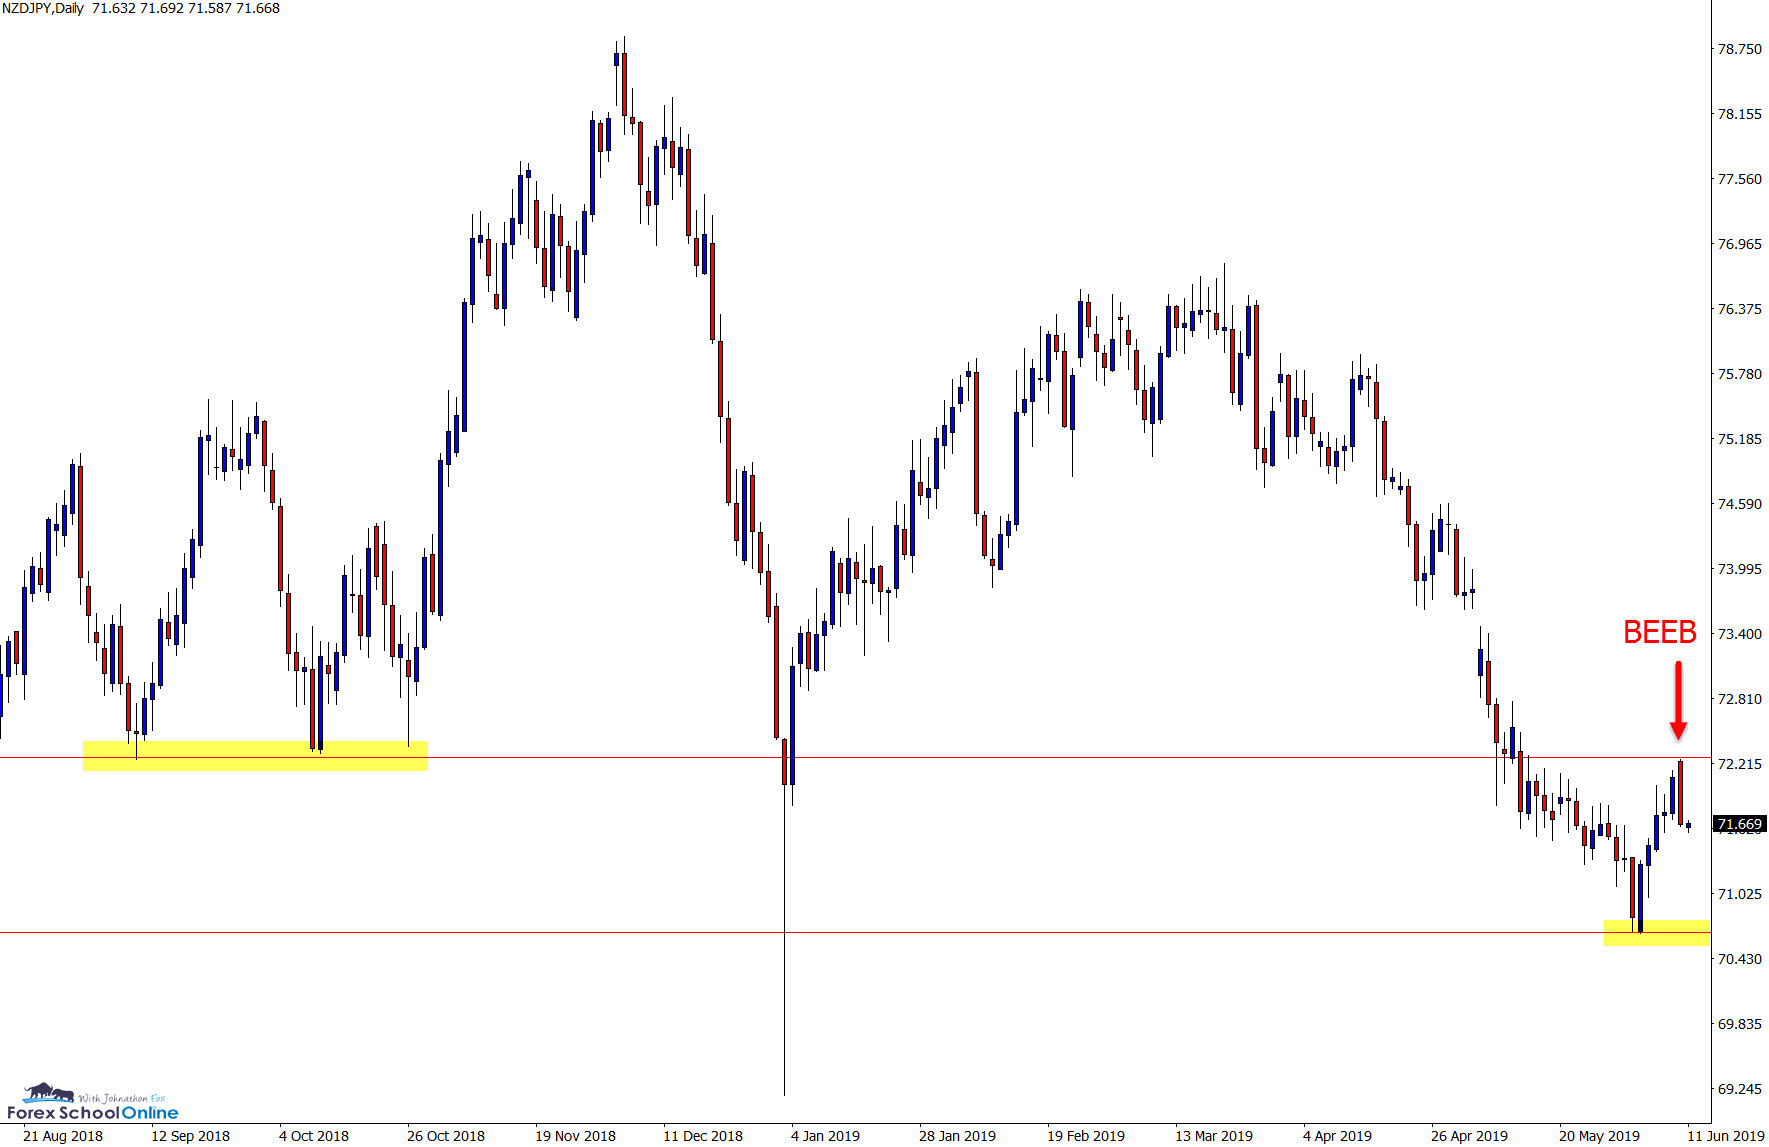
NZDJPY Daily Chart
Daily Chart Bearish Engulfing Bar
Price on the daily chart of the NZDJPY has retraced back higher into the overhead resistance level and formed a bearish engulfing bar.
For price to break and make a move lower and continue with the strong momentum that has been in play lately, we would need to see price break the low of the engulfing bar and the minor support that it is sitting on.
If price can break lower, then we could see a move into the next swing low around the 70.70 area.
Daily Chart
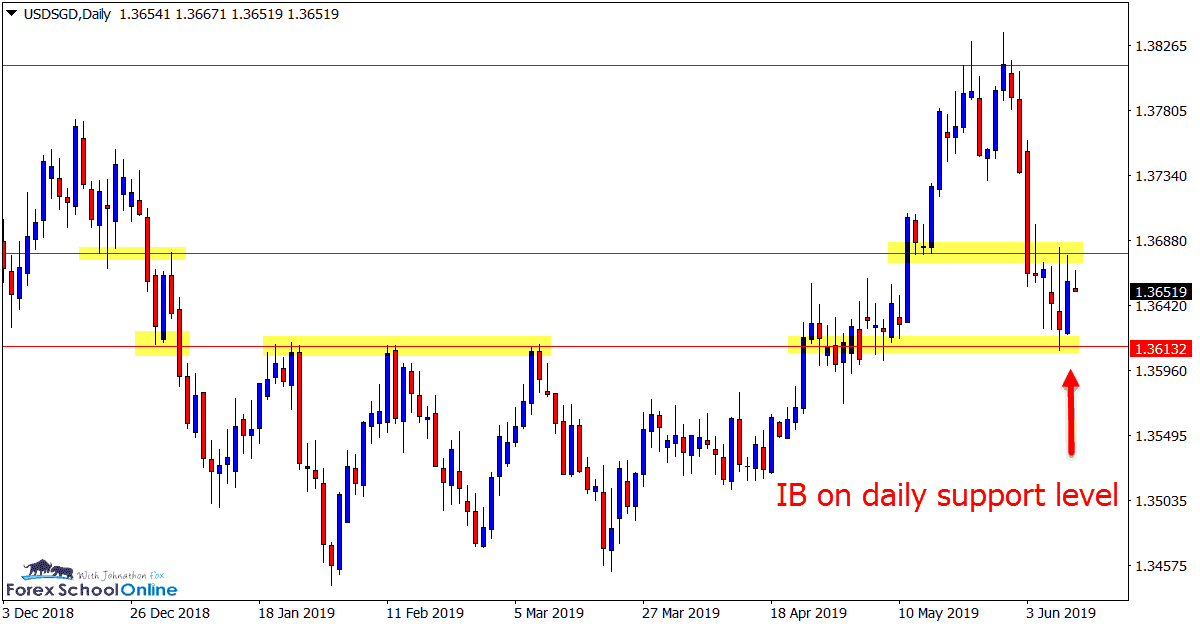
USDSGD Daily Chart
Inside Bar Stuck Between Levels
Price action on the daily chart of the USDSGD has printed an inside bar that is stuck between a daily support and resistance level.
After making a nice move higher, price failed to breakthrough the major daily resistance and has since slammed back lower to now be stalling between the two levels.
The support on the daily chart is a major level and if price can breakout and through the inside bar lows, it could open the way for fast breakout trade setups.
Daily Chart
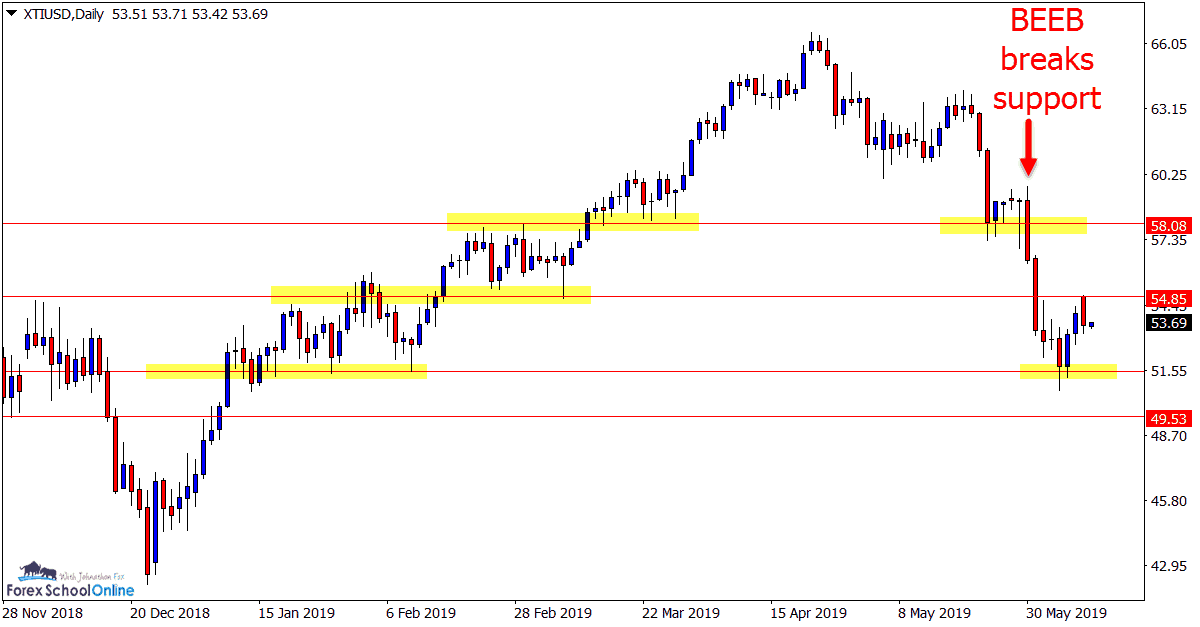
OIL v USD Daily Chart
2 Bar Rejects Support
This market has been a market of price flips in recent times with price making a nice run higher, only to flip lower with a series of supports holding as new resistance.
Whilst price slammed lower and through a daily support with a large Bearish Engulfing Bar = BEEB that engulfed its previous four candles, price has now rejected the daily support with a bullish 2 bar.
I am on the sidelines with this market until price potentially moves into the 58.00 resistance area or can confirm a move lower with a break.
Daily Chart
Note: We Use Correct ‘New York Close 5 Day Charts’ – You can read about why we use these and how to download the correct free charts at Correct Free New York Close Demo Charts
Trade Ideas Note: All views, discussions and posts in the ‘charts in focus’ are the view of Forex School Online and are not recommendations or trading advice. All posts are general in nature and are not advice to buy or sell.
Please leave questions or comments in the comments section below;


Leave a Reply