Weekly Price Action Trade Ideas – 10th to 15th Nov 2019
Markets Discussed in This Week’s Trade Ideas: EURGBP, NZDUSD, USDSGD and GOLD.
Note: We Use Correct ‘New York Close 5 Day Charts’ – You can read about why we use these and how to download the correct free charts at Correct Free New York Close Demo Charts
NZDUSD Daily Chart
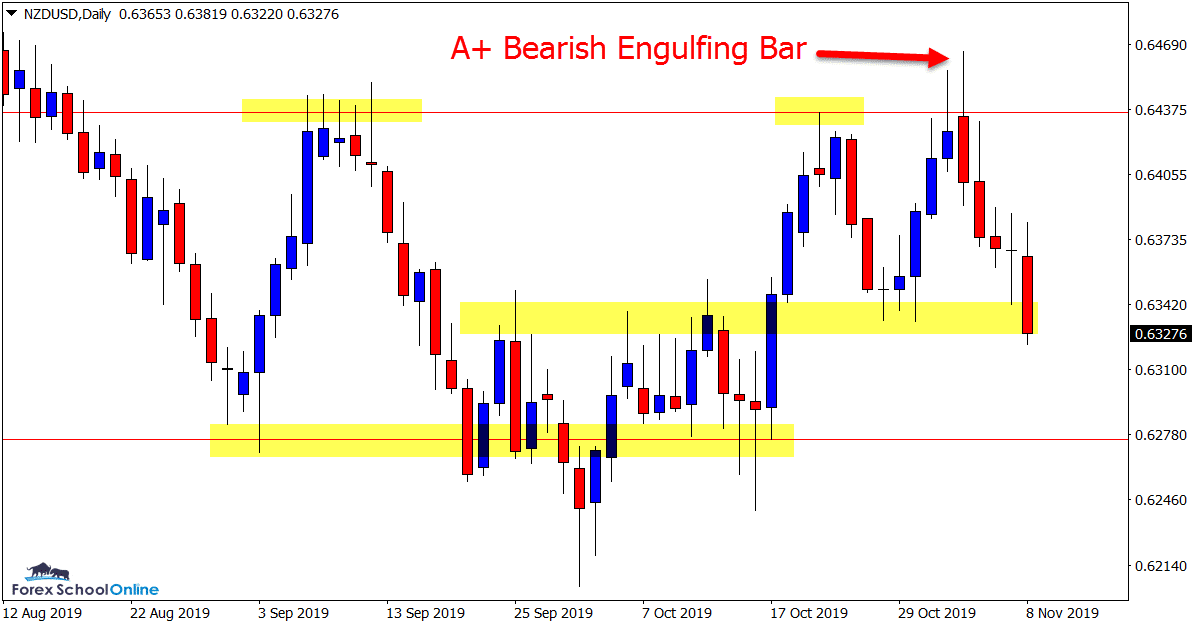
Classic Daily Chart Engulfing Bar
Price action during the week in this market made a move higher to test the major daily resistance level. This was a level that had been proven repeatedly in recent times with price rejecting higher prices with an engulfing bar and a pin bar.
After forming a high probability Bearish Engulfing Bar – BEEB, price sold off aggressively into the first minor support level as the chart shows below.
Traders who made this daily chart trade could have factored this into their trade management and pre-trade planning.
If price can now break this support level we could see a move into the lows of the daily chart consolidation range pattern.
Daily Chart
EURGBP Daily and 4 Hour Charts
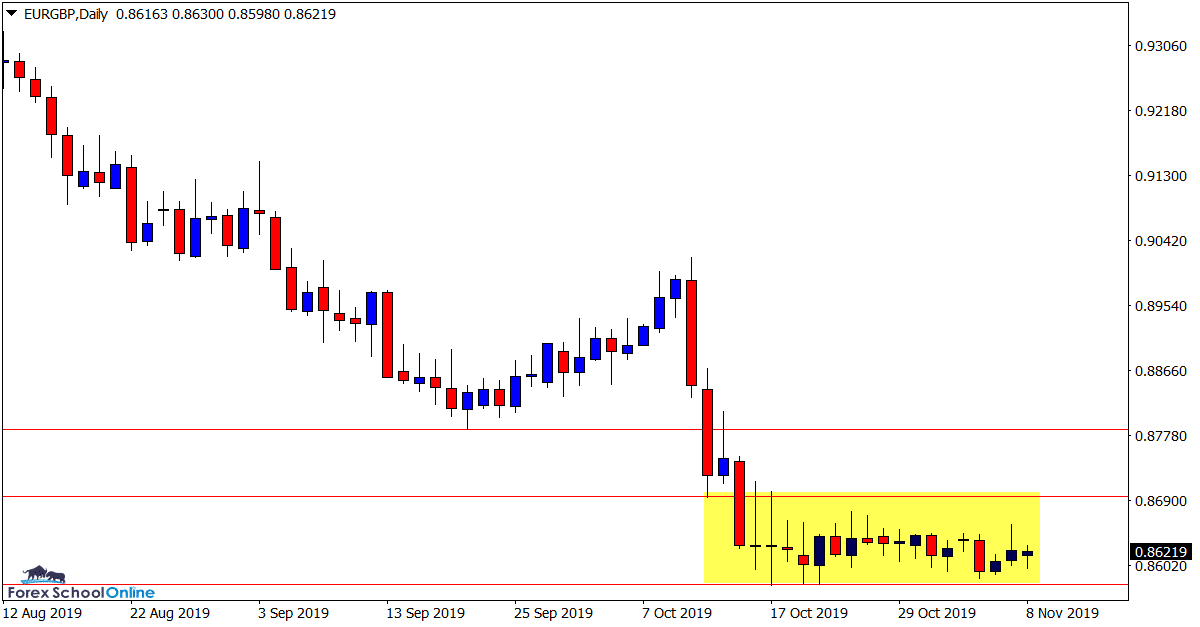
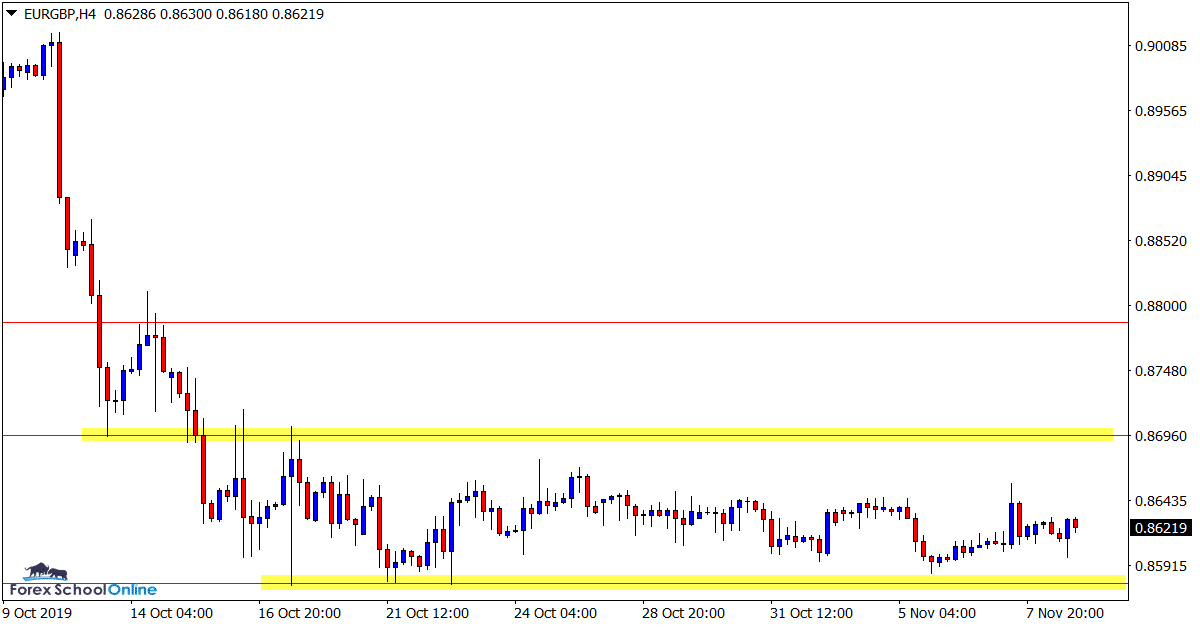
Still Stuck in Sideways Box
A lot of the GBP pairs are showing very similar price action to what the EURGBP is currently.
As both the daily and 4 hour charts show below; price is stuck trading sideways in a very congested box pattern.
The best play in this market could be to simply wait for the breakout when it finally occurs and follow the price action clues.
Trading whilst price is in such a constricted range looks risky and when the breakout does occur it could be explosive.
Daily Chart
4 Hour Chart
USDSGD Daily and 1 Hour Charts
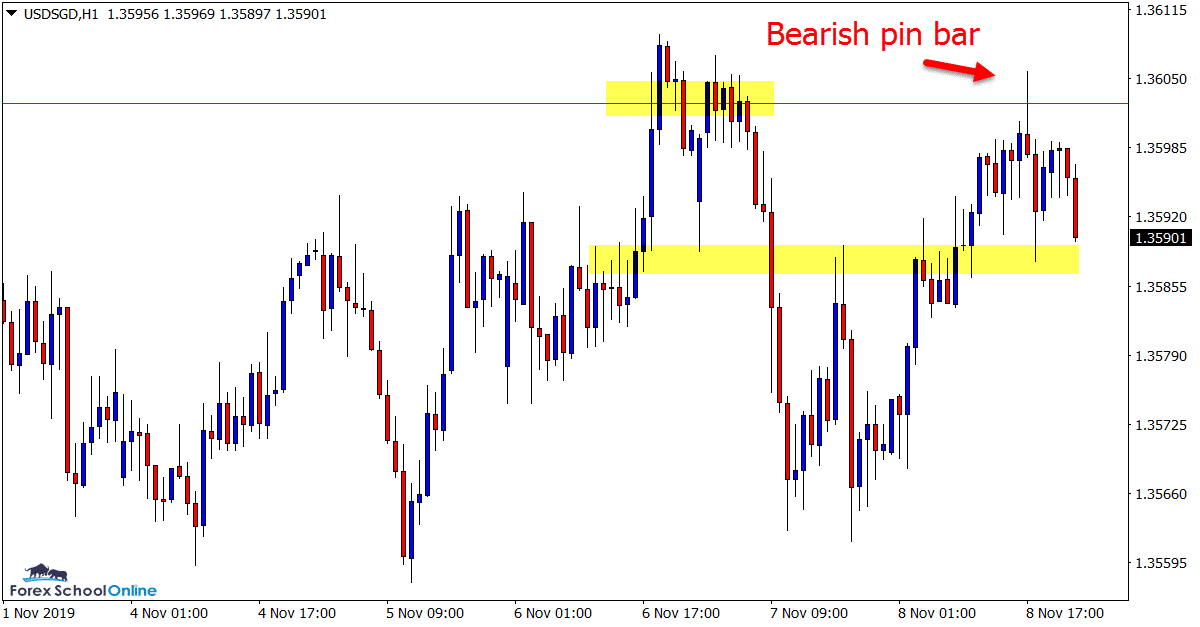
Second Chance Pin Bar
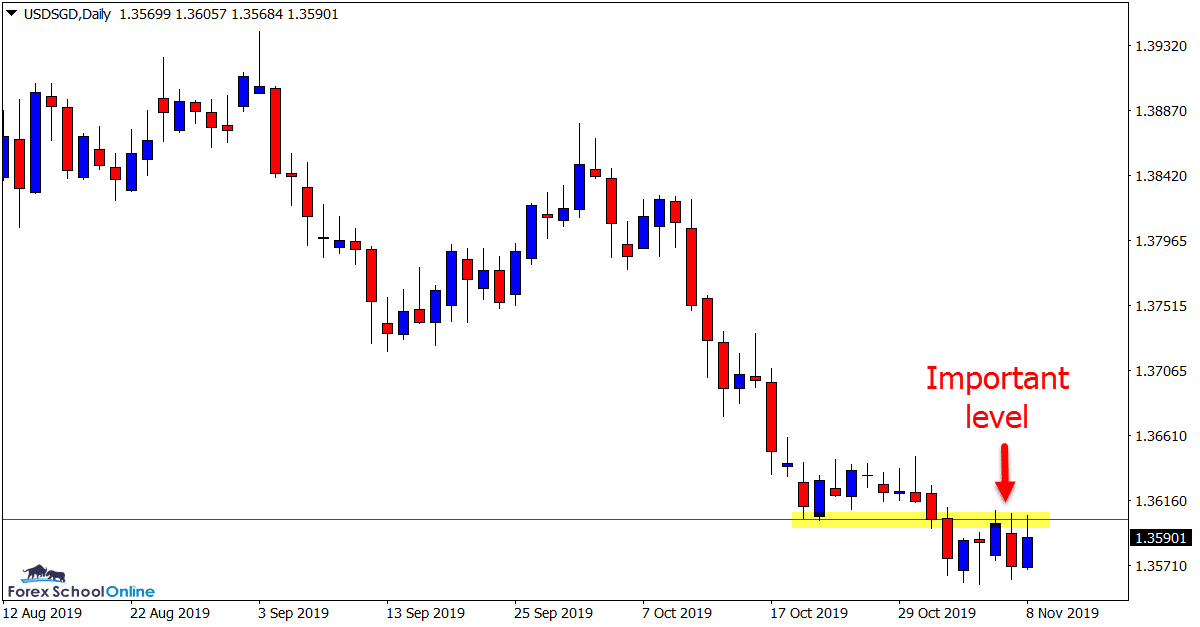
In last week’s trade ideas we were looking to see if price could carry on with the breakout move it was beginning.
During the week we saw price make a rotation higher into the breakout old support and new resistance.
Whilst price did rotate back lower and back into the recent swing lows it has not as yet continued on with the move lower with price popping back higher.
Traders looking for a second chance entry on the intraday charts were presented with a 1 hour pin bar at the same daily chart level, however; this presents with a close first support level.
This is an interesting market and I am happy to watch on to see if the resistance holds and if price can breakout before potentially hunting trades again.
Daily Chart
1 Hour Chart
Gold Daily and 4 Hour Charts
Inside Bars
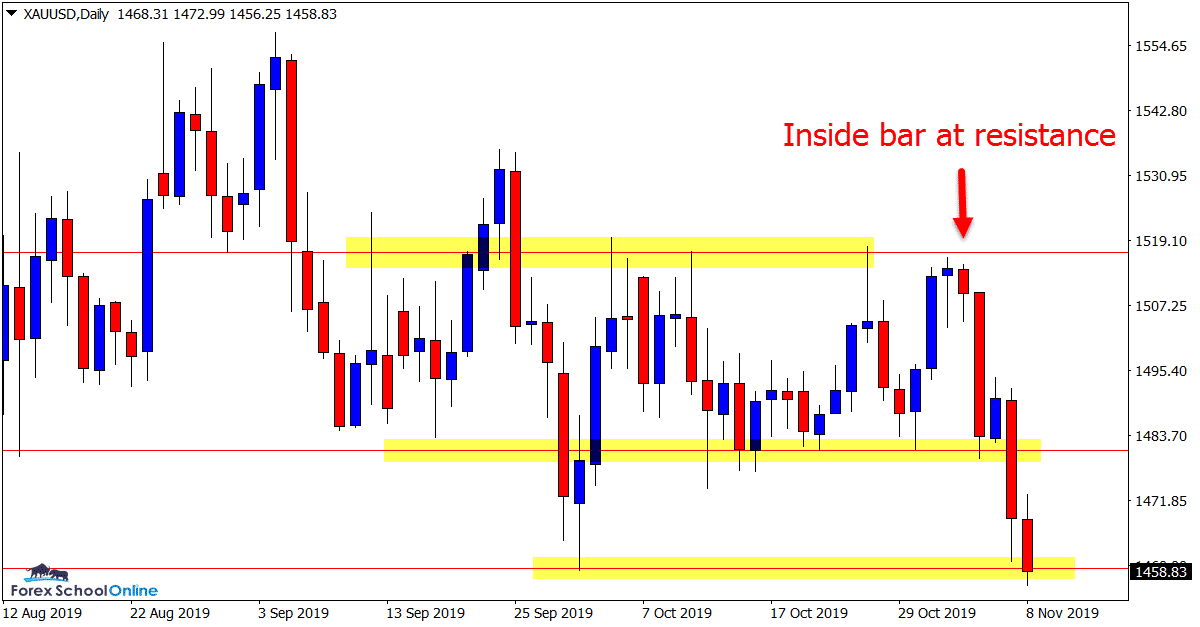
In last week’s trading ideas we looked at this market and the test of the daily resistance, looking for a potential breakout higher.
Price was able to hold at the resistance forming an inside bar and collapsing lower.
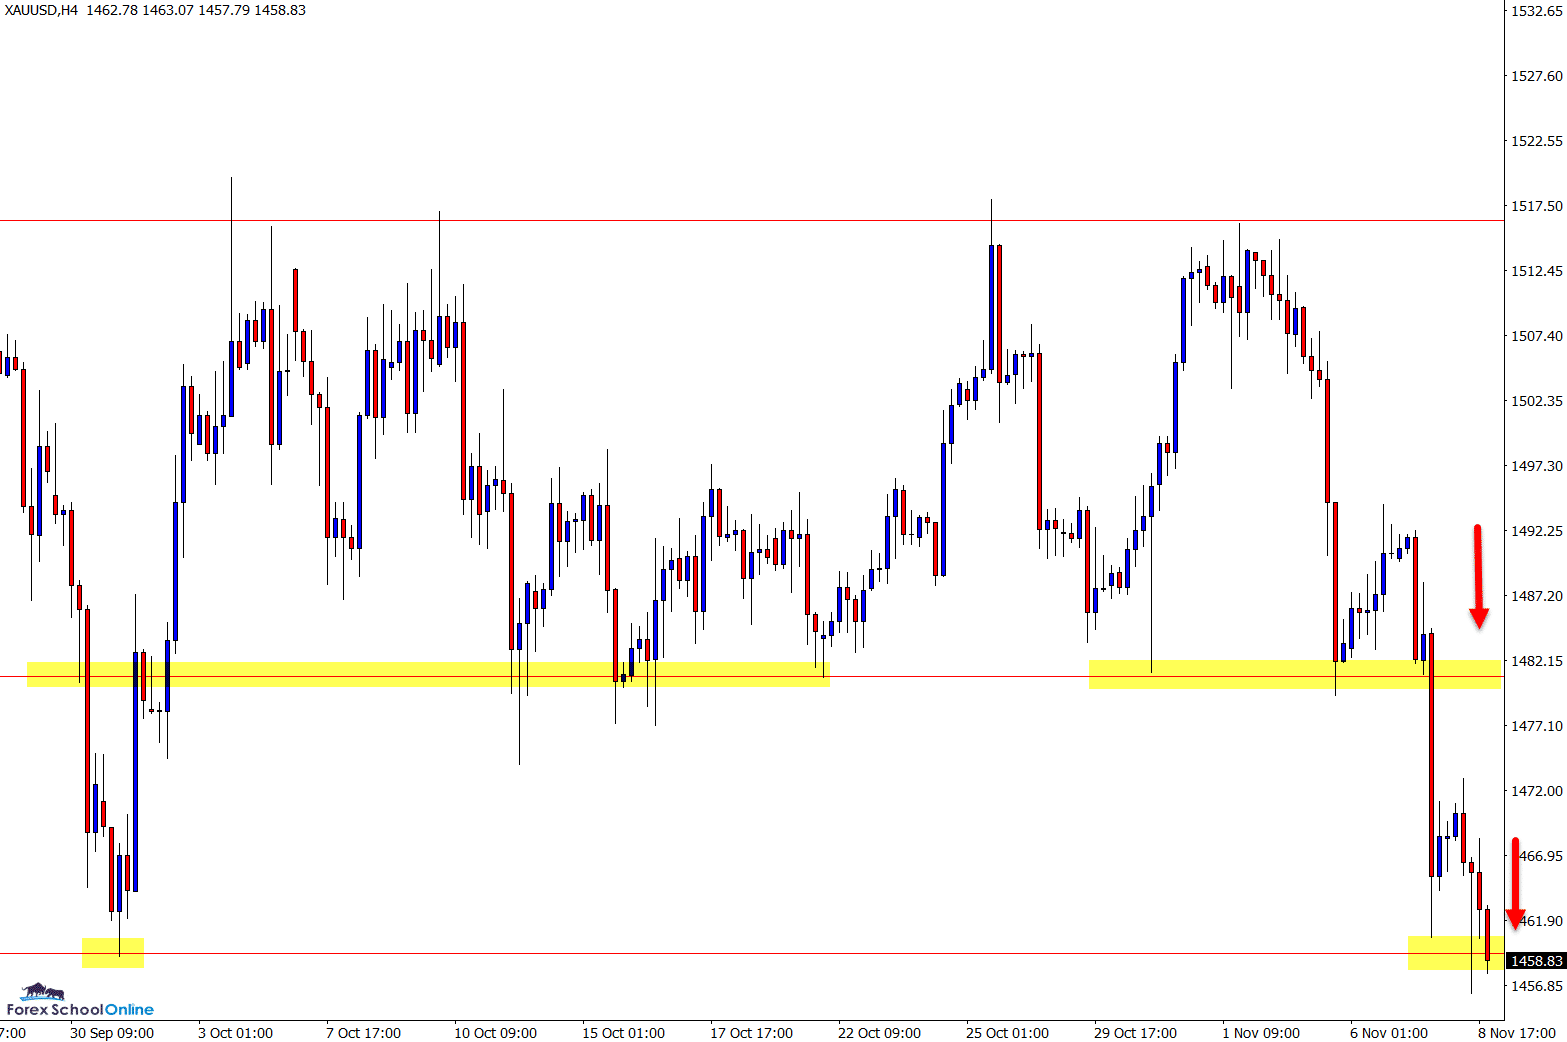
Whilst price has made a solid move lower in the last few sessions price is still caught within the overall consolidation. This could quickly change this week if we can finally get a confirmed breakout.
As the daily chart shows below; price is sitting on the recent swing support level. If price can break this, then bearish traders could look for potential breakout trades. If this level holds and we get a rotation higher, then the old support could look to act as a new resistance level (see 4 hour chart below).
Daily Chart
4 Hour Chart
Trade Ideas Note: All views, discussions and posts in the ‘charts in focus trade ideas’ are the view of Forex School Online and are not recommendations or trading advice. All posts are general in nature and are not advice to buy or sell.
Note: We Use Correct ‘New York Close 5 Day Charts’ – You can read about why we use these and how to download the correct free charts at Correct Free New York Close Demo Charts
Please leave questions or comments in the comments section below;


Leave a Reply