Weekly Price Action Trade Ideas – 10th to 15th March 2019
Markets Discussed in This Weeks Trade Ideas: AUDUSD, GOLD, OIl v USD and US500
Note: We Use Correct ‘New York Close 5 Day Charts’ – You can read about why we use these and how to download the correct free charts at Correct Free New York Close Demo Charts
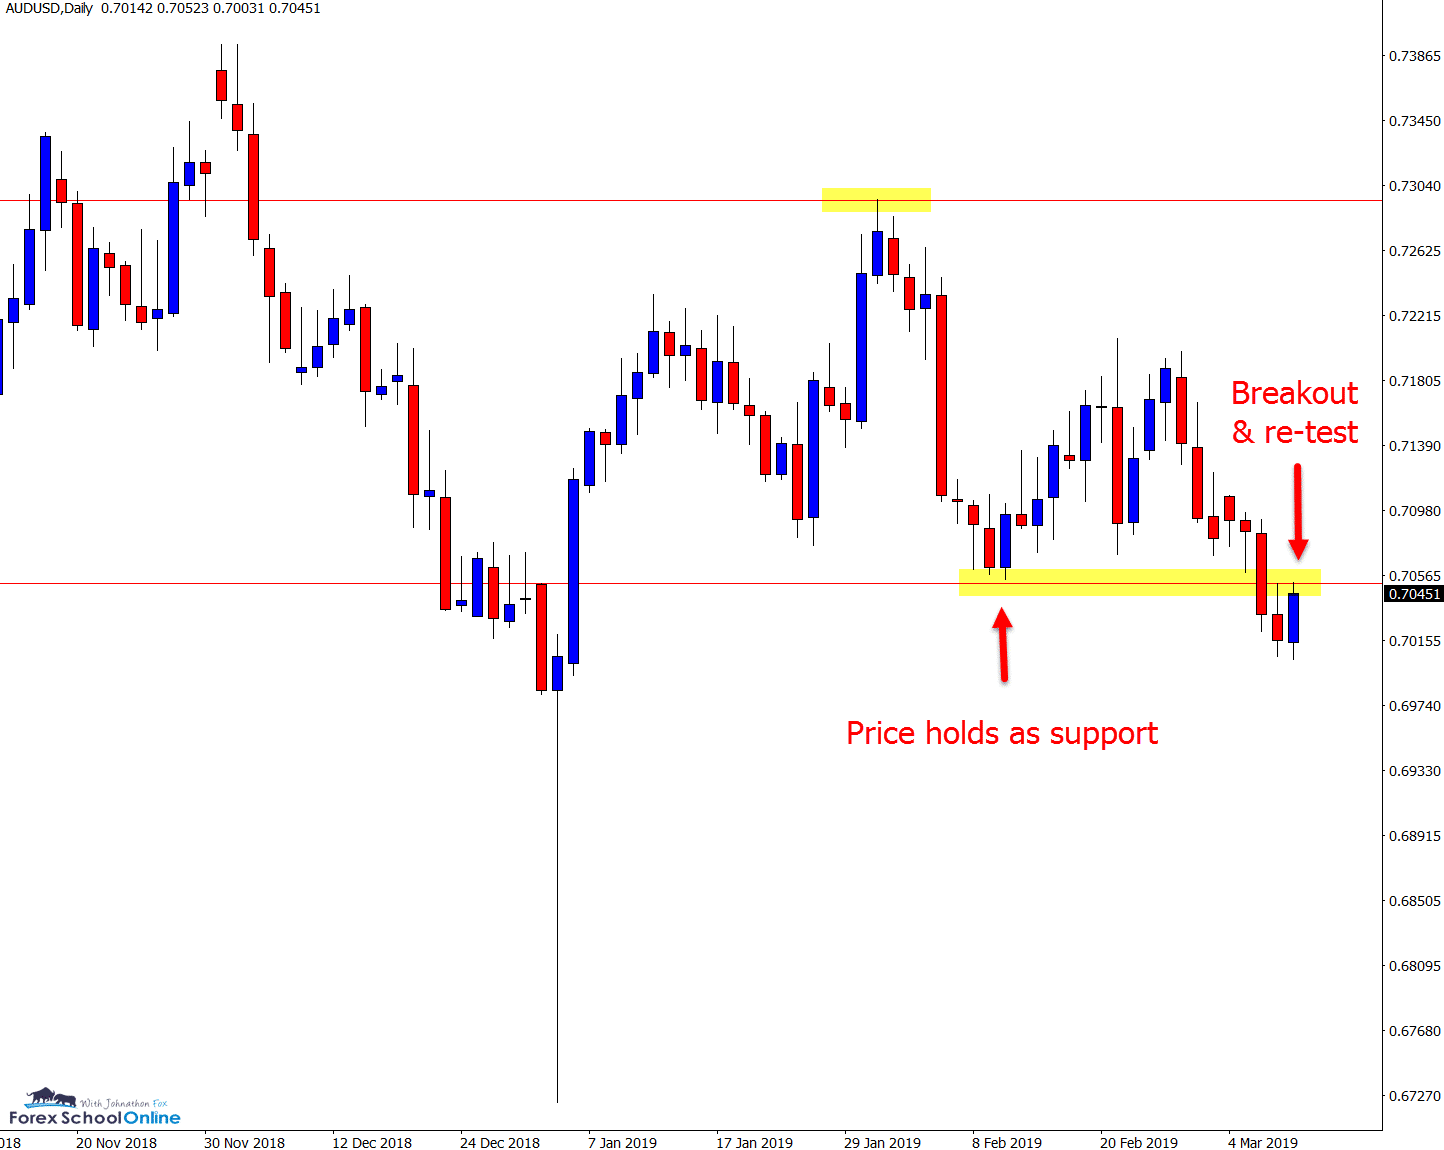
AUDUSD Daily & 30 Minute Chart
Breakout & Quick Re-Test
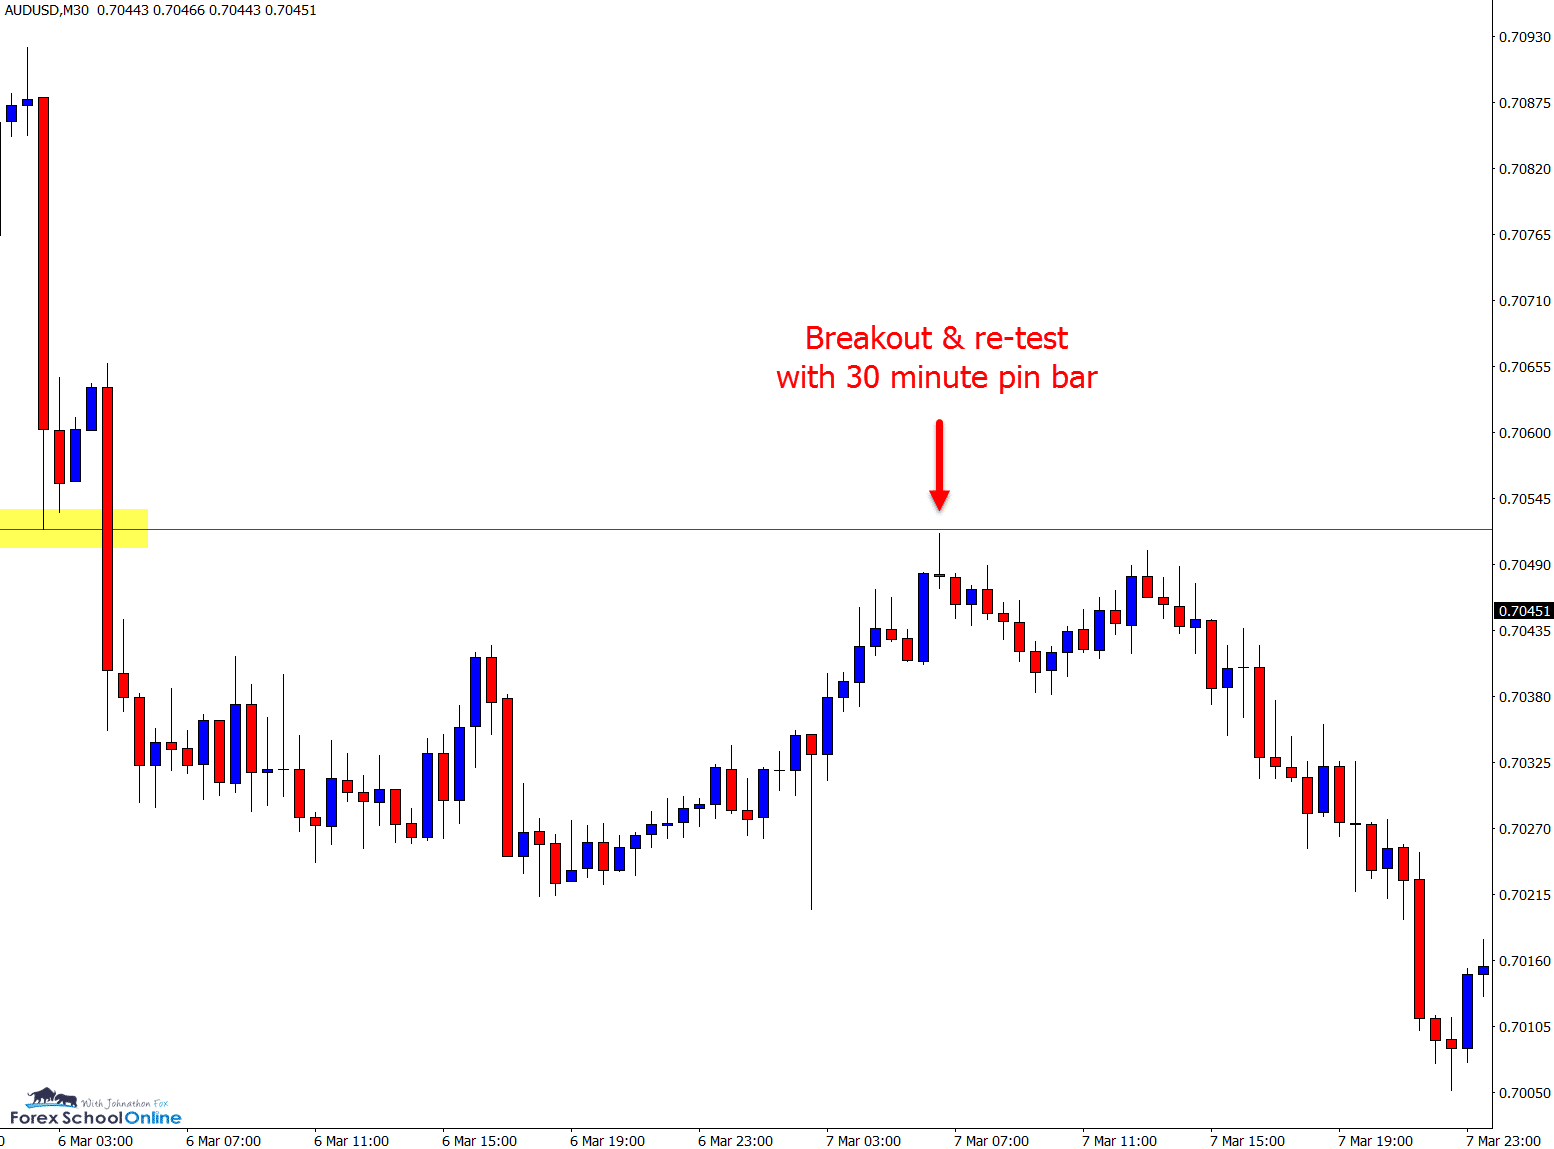
Price during the past week broke lower and through the 17 x session box that price had been stalling inside of.
In last week’s trade ideas that we posted on the 3rd of March, we discussed this tight box price had found itself stuck in and which way it would break.
As the two charts show below; price did breakout lower and quickly to the downside with price making a quick re-test and bearish pin bar reversal on the 30 minute chart for those traders looking to get short on the break.
We discuss how to make these quick breakout trades in a recent video you can watch at; How to play quick breakout trades
Daily Chart
30 Minute Chart
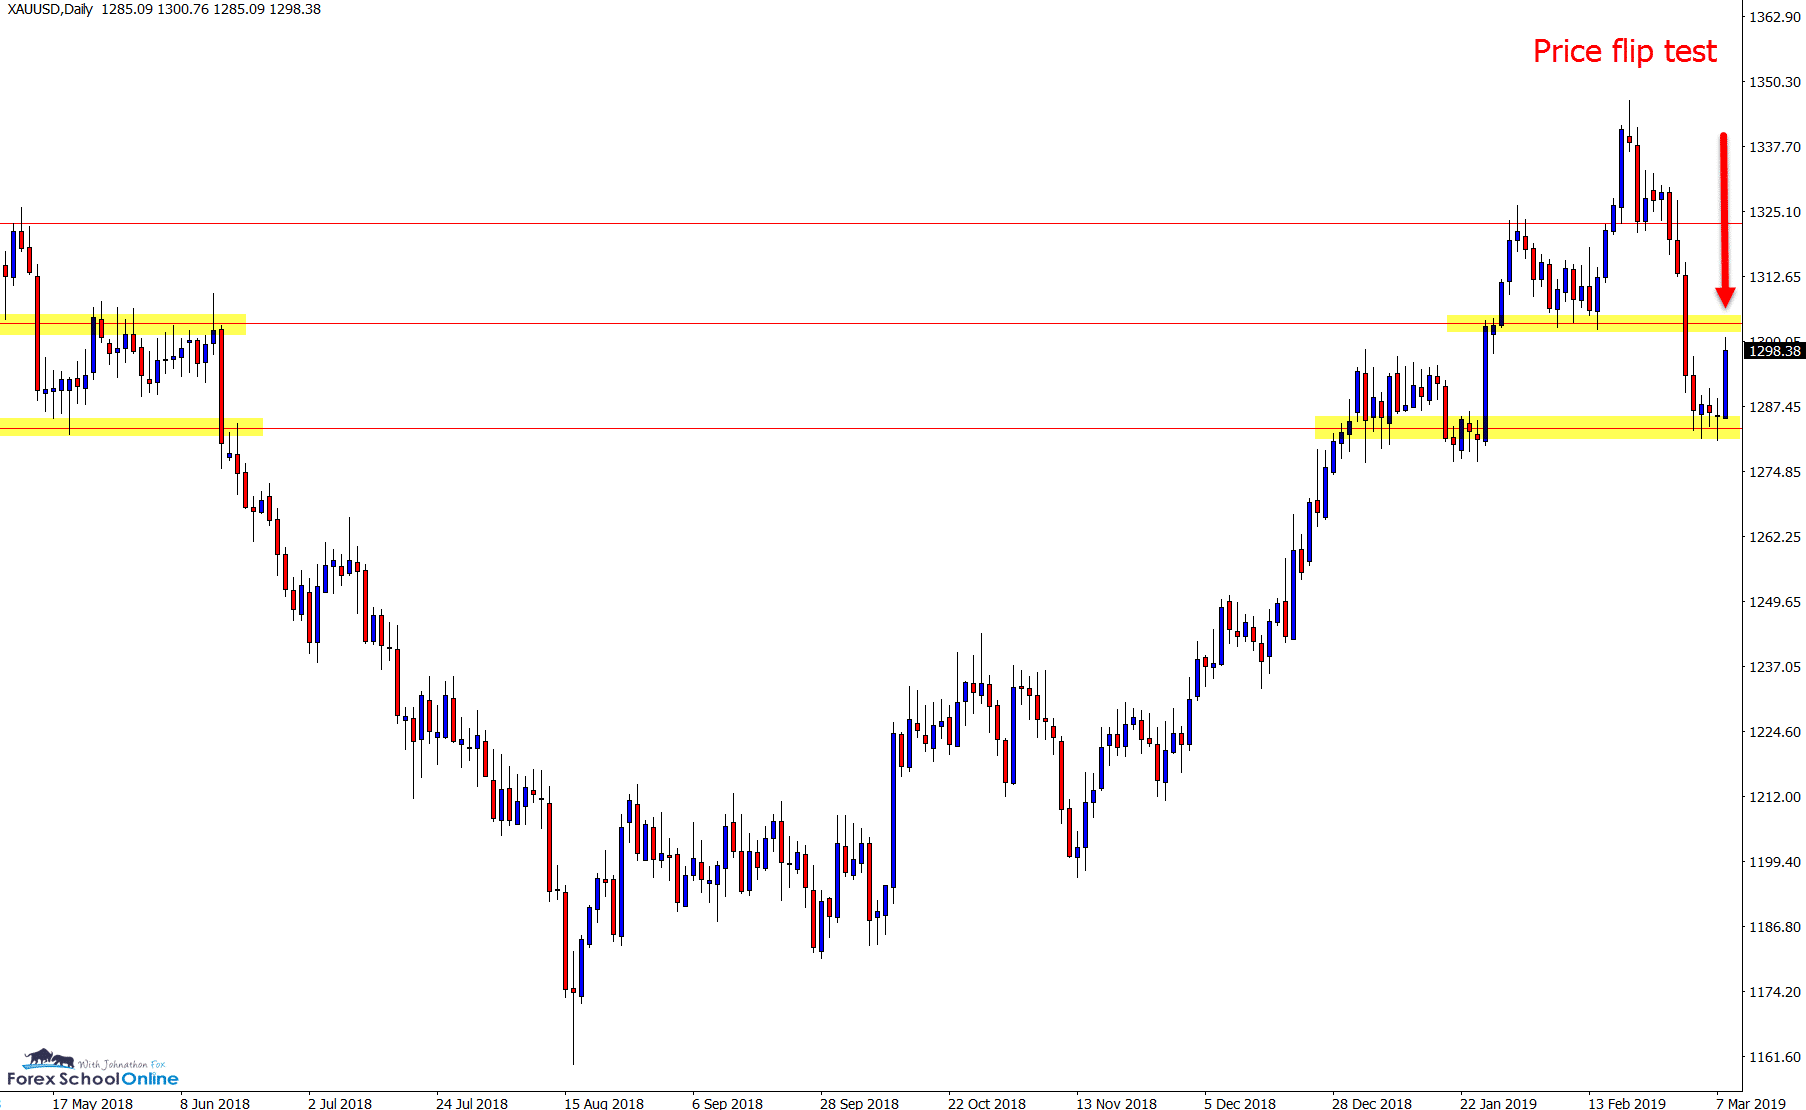
GOLD Daily and 4 Hour Charts
Crucial Price Flip Overhead
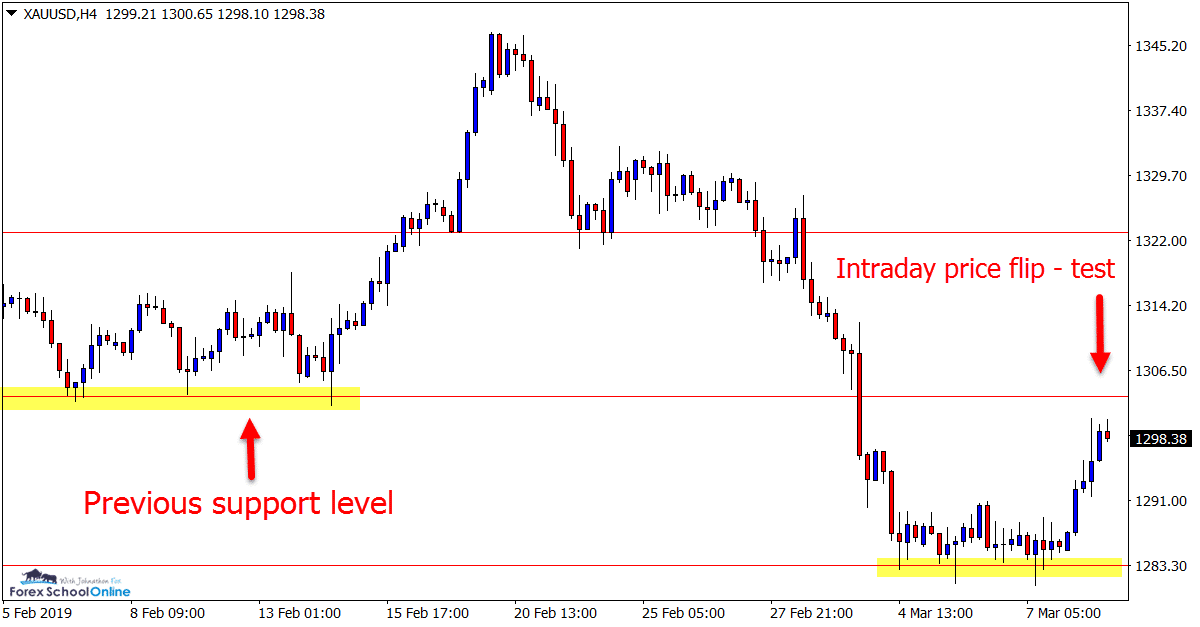
After slamming lower and through two major support levels in the space of three days, price has now paused and found support.
The coming sessions look to be crucial for this market and if the bulls will make a serious attempt at regaining the trend higher, or the bears roll this market back lower.
As both the daily and 4 hour charts show below; there is a key price flip (old support / new resistance) level coming in just overhead.
Bearish traders could watch to see if price fires off any high probability A+ trades at this level or conversely it breaks straight back through.
Daily Chart
4 Hour Chart
OIL v USD Daily Chart
Will Market Reversal Play Out
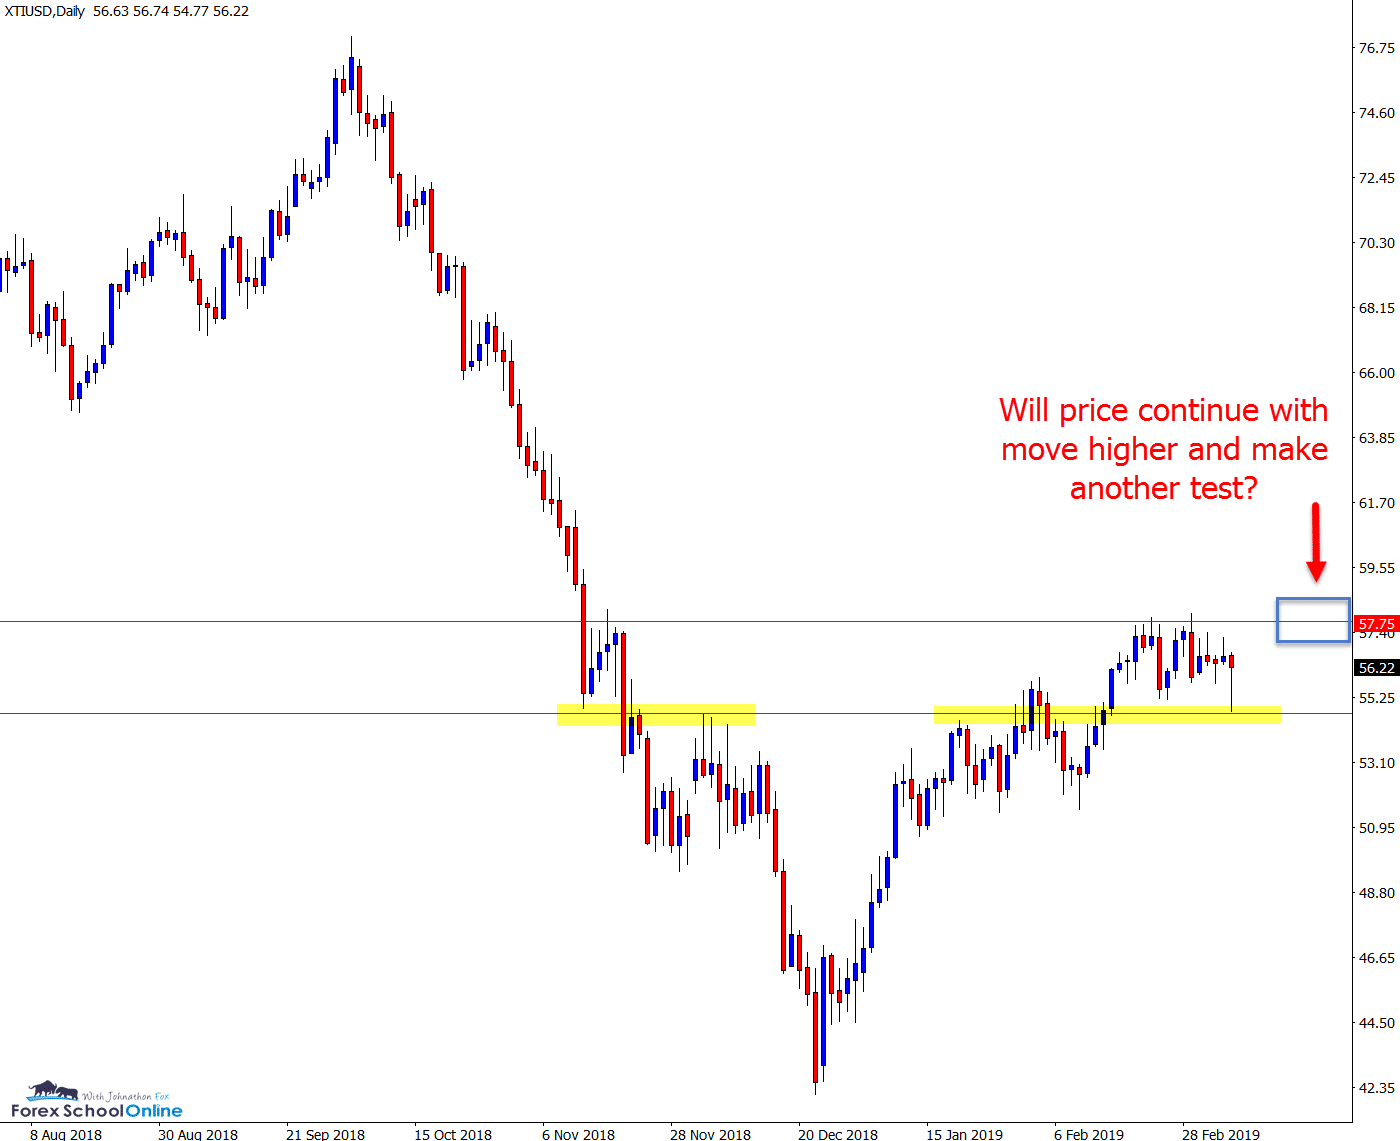
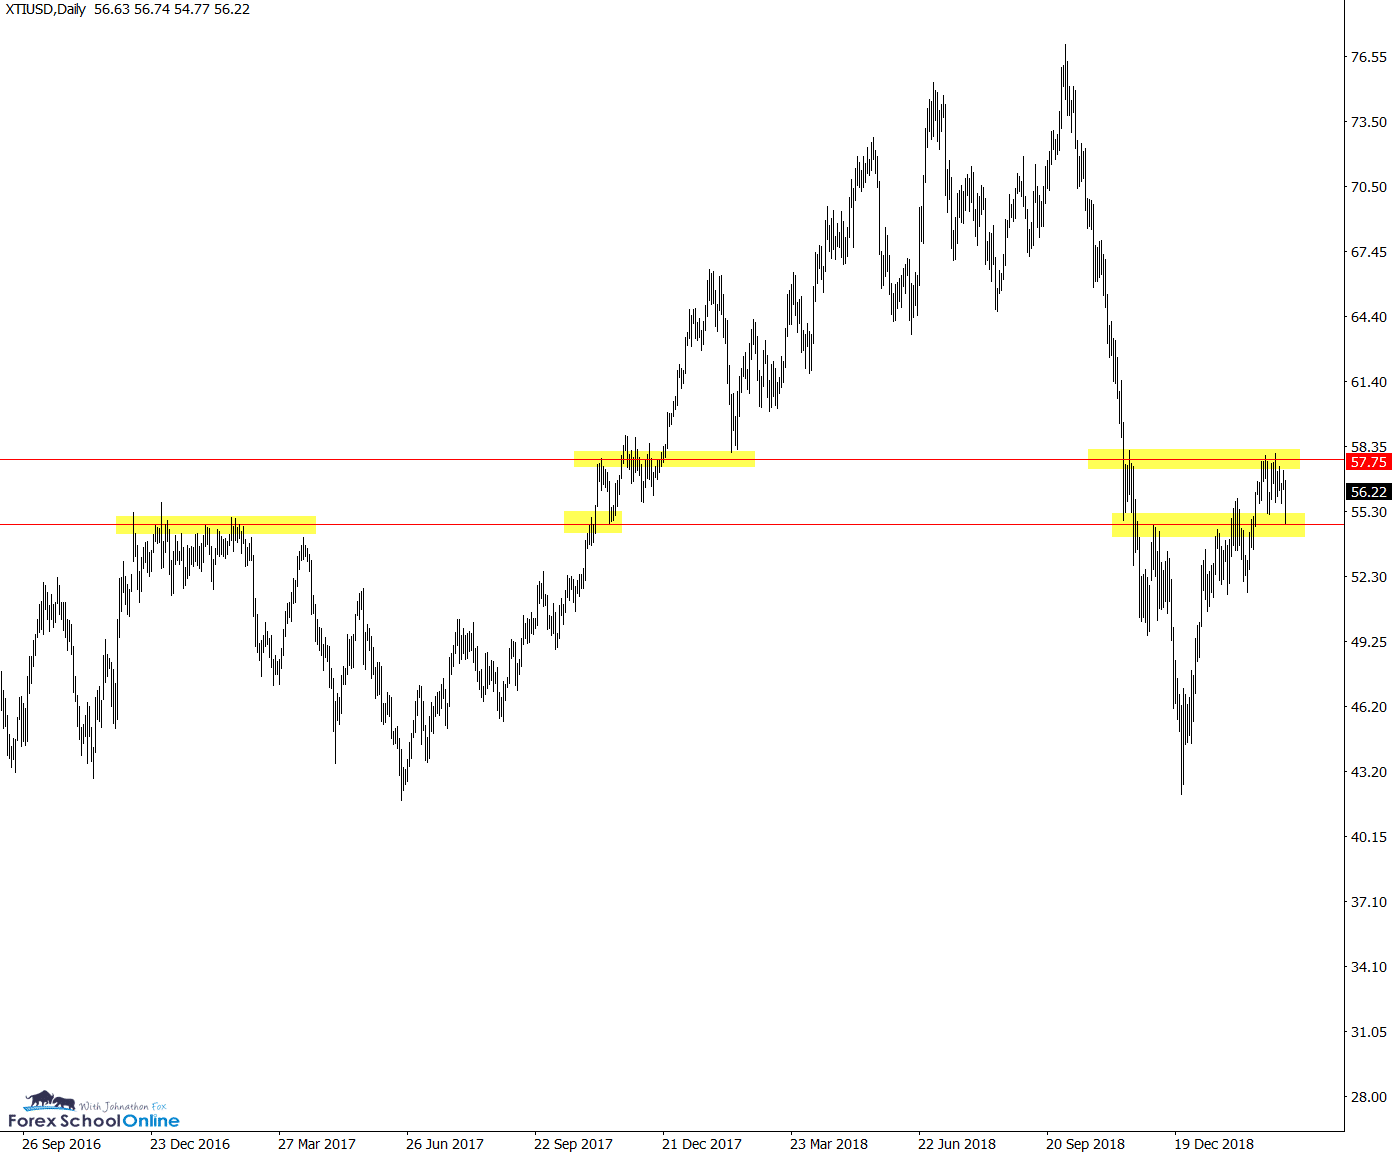
Whilst this market has been attempting to form a market reversal and trend back higher in recent times, it is facing a test at the daily resistance level.
After making two attempts at breaking this level already, price has moved lower and is now trading sideways building for its next move.
If price can bounce from the daily chart support it currently sits on, it could gain momentum to make another test of the resistance. If this level gives way, then we could see price make a free-flowing move higher.
Bullish traders could then look for breakouts or breakout and re-test trade setups.
Daily Chart
Daily Chart
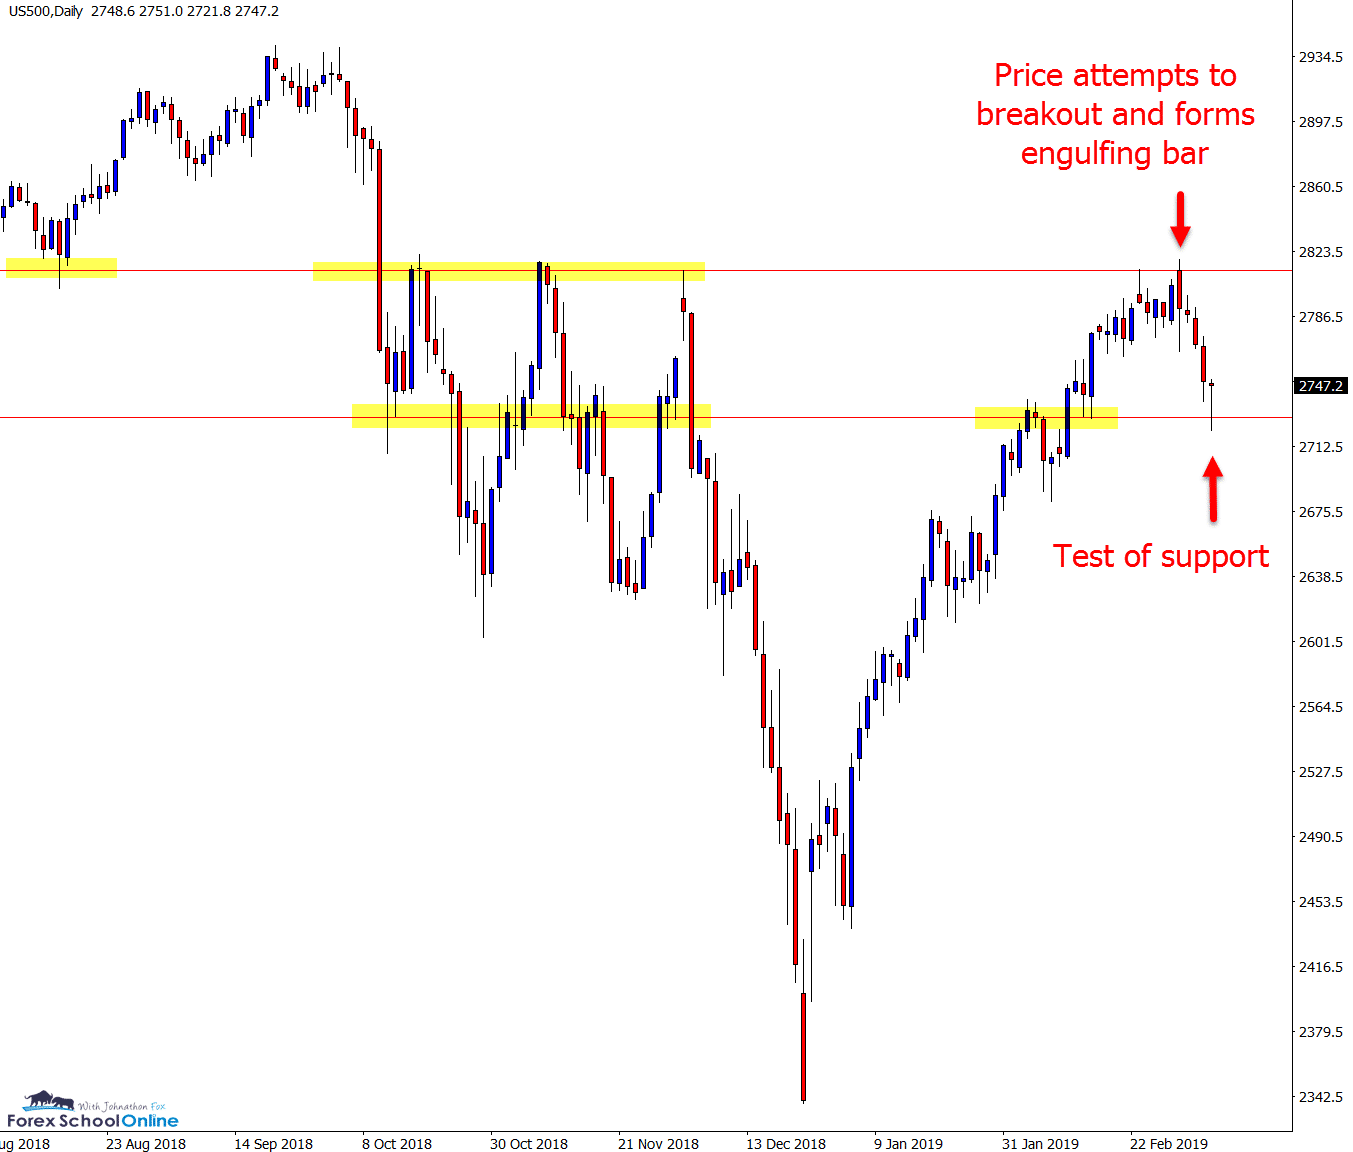
US500 Daily Chart
Engulfing Bar Sends Price Into Support
We have been watching this market quite a lot in recent times because of the major resistance price looked to be tracking into on the daily chart.
After pushing higher and making an attempt at breaking this resistance, price formed a Bearish Engulfing Bar = BEEB sending price back lower in the process.
Price has now found support and formed a small bullish pin bar that could see price make a fresh re-test of the daily resistance level. Any break below this support and it could quickly act as a new price flip level.
Daily Chart
Charts in Focus Note: All views, discussions and posts in the ‘charts in focus’ are the view of Forex School Online and are not recommendations or trading advice. All posts are general in nature and are not advice to buy or sell.
Please leave questions or comments in the comments section below;


Leave a Reply