Weekly Price Action Trade Ideas – 10th to 14th Feb 2020
Markets Discussed in This Week’s Trade Ideas: EURUSD, AUDSGD, AUDUSD and SILVER.
Note: We Use Correct ‘New York Close 5 Day Charts’ – You can read about why we use these and how to download the correct free charts at Correct Free New York Close Demo Charts
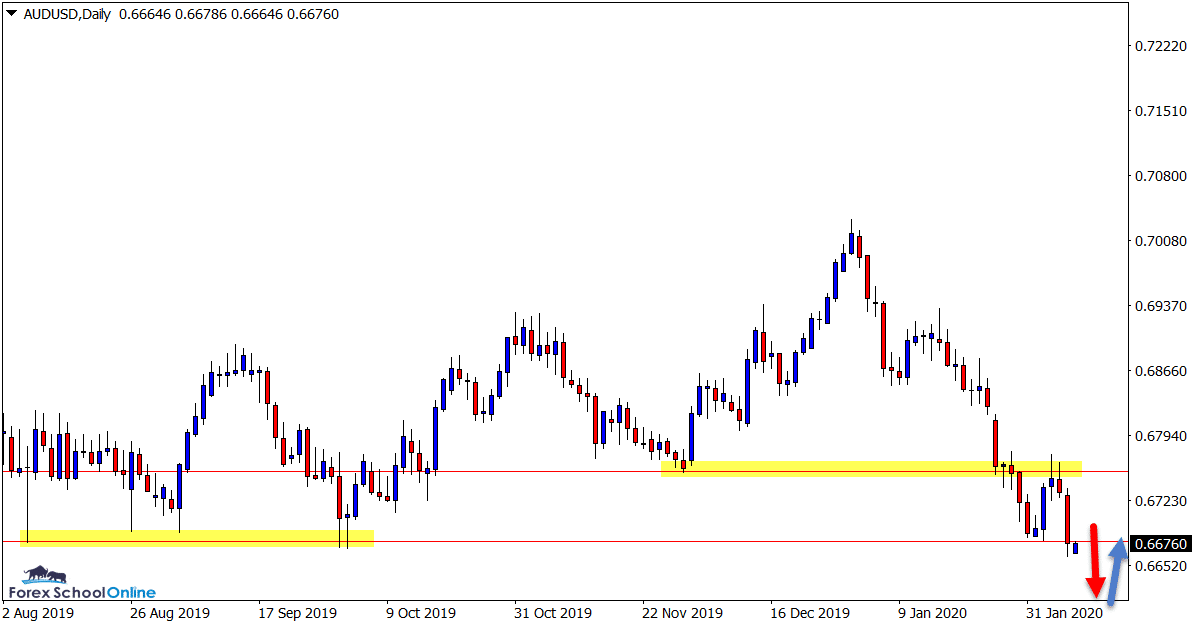
AUDUSD Daily Chart
Can Price Break Support?
In the last few weeks we have seen a lot of markets begin to shake out and make some solid, free flowing moves and this is evident in the AUDUSD.
In last week’s trade ideas we were looking to see if the support level would at least hold for a small bounce higher and for potential new short trades to eventuate.
Now this has played out, the daily support level comes into play again. This time the major watch will be on to see if price can make a new break of this level and if potential breakout or breakout and retest trades open up.
Daily Chart

EURUSD Daily Chart
Watching for Weakness / Pullbacks
Whilst still stuck in the sideways market that we have discussed at length in recent times, this pair is making some nice solid moves.
In recent sessions we have seen price aggressively move lower and also breakout of the daily chart support level.
Whilst the overhead resistance remains intact lower prices could come into play and the old support / new resistance level could act as a solid level to watch for potential short trades.
There is also a near term support level that is of interest because if price can make a substantial break, then we could quickly see price break lower into the next major support level.
Daily Chart

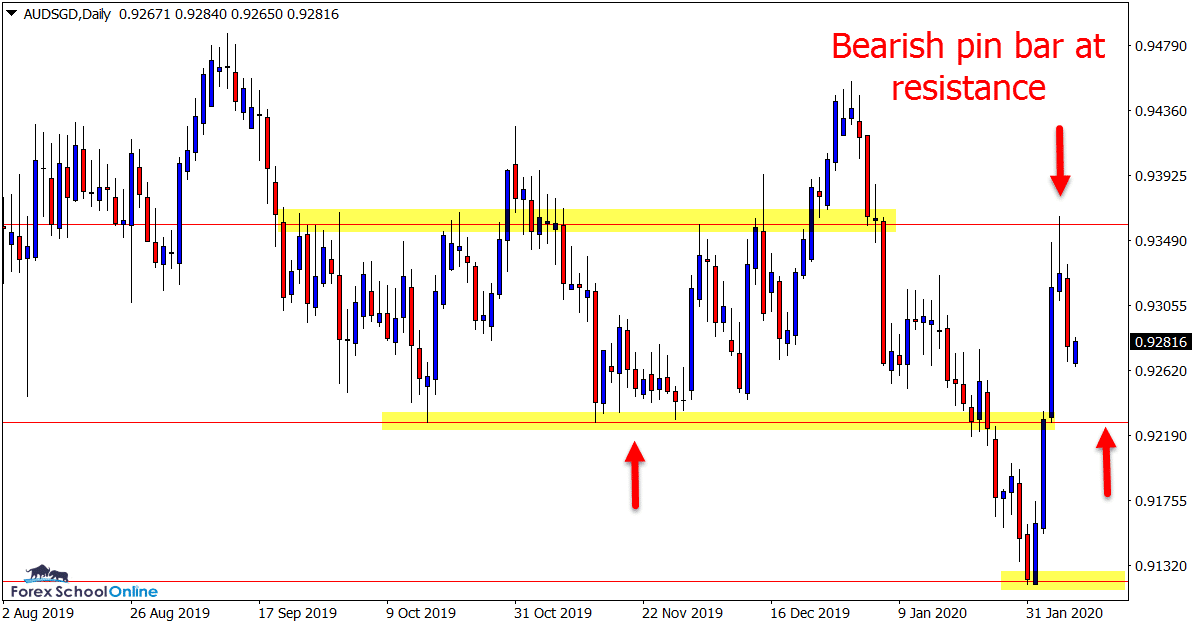
AUDSGD Daily Chart
Watching Range Levels
After the large sell off recently in the Aussie pairs we were watching the AUDSGD to see if the old support level that price had just broken out of would hold as a new resistance.
After rotating back higher, price busted right through and continued into the next overhead resistance. This is where price was halted with the most recent bearish pin bar.
This is an interesting one now because price is stuck between two important support and resistance levels.
Until price makes a new clean break out of this range area, then both sides of the market can look to be played at the major levels.
Daily Chart

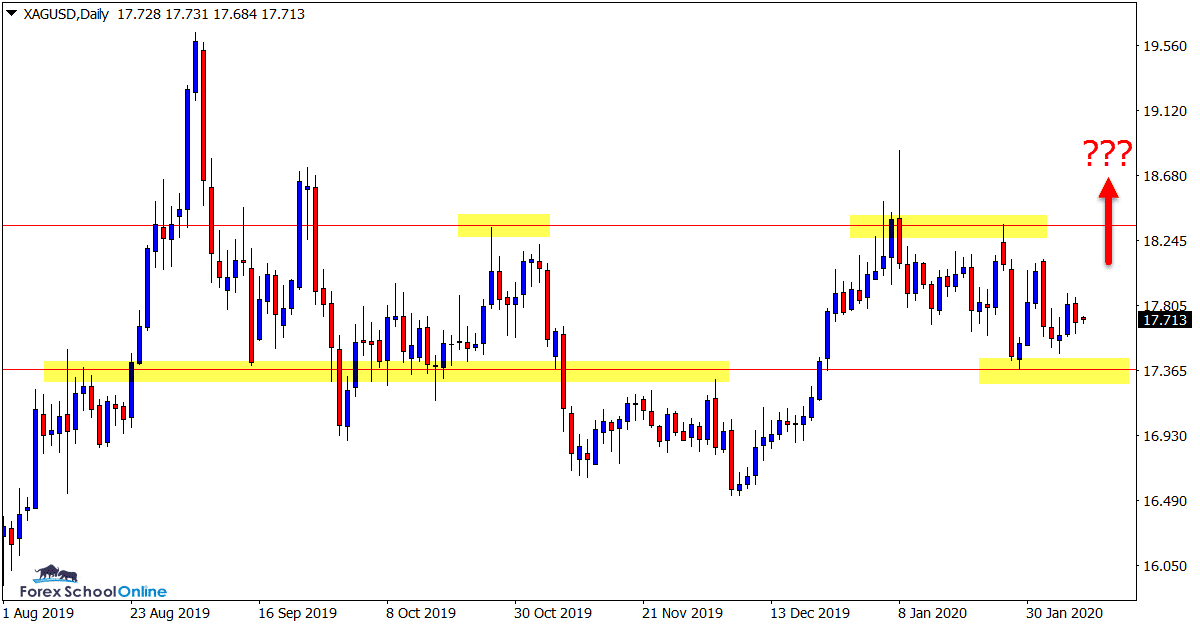
SILVER Daily Chart
Looking for Potential Breakouts
Price has been meandering along sideways in the Silver market for the past few weeks not really going anywhere but sideways.
Whilst this sideways movement persists the opportunities to make trades look slim and also very tricky.
If and when price makes a breakout, we could very quickly see price make its next fast and aggressive move and with it open up a lot of new trading opportunities.
Daily Chart

Trade Ideas Note: All views, discussions and posts in the ‘charts in focus trade ideas’ are the view of Forex School Online and are not recommendations or trading advice. All posts are general in nature and are not advice to buy or sell.
Note: We Use Correct ‘New York Close 5 Day Charts’ – You can read about why we use these and how to download the correct free charts at Correct Free New York Close Demo Charts
Please leave questions or comments in the comments section below;


Leave a Reply