Weekly Price Action Trade Ideas – 10th Dec 2018
Markets Discussed Today: AUDUSD, GBPUSD, CADCHF & GBPAUD
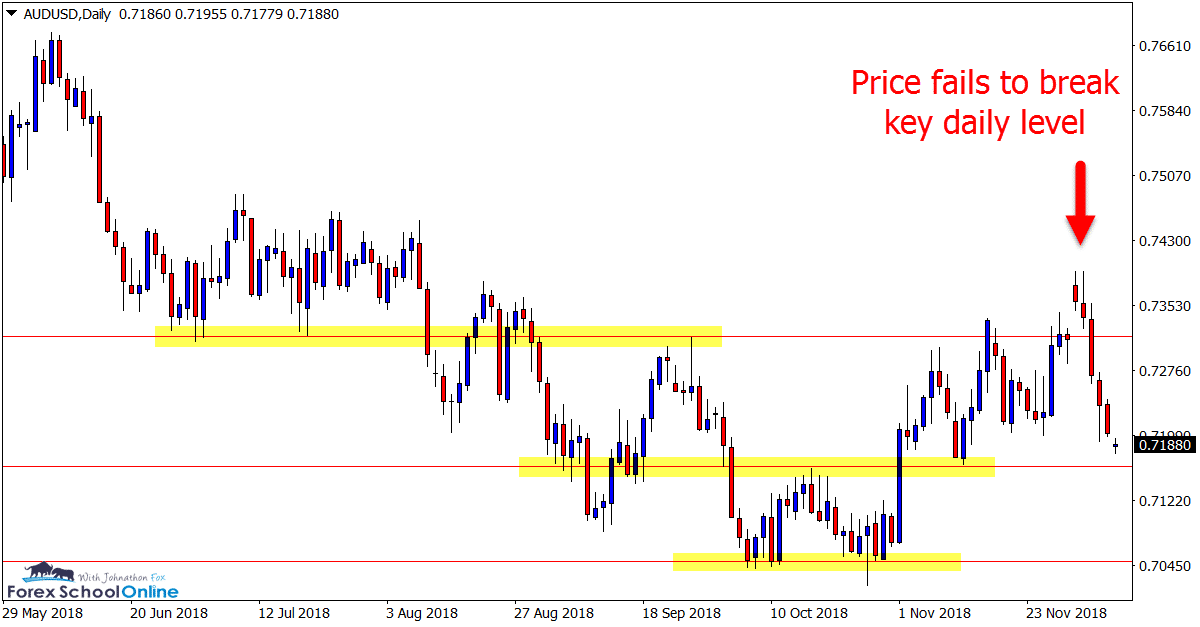
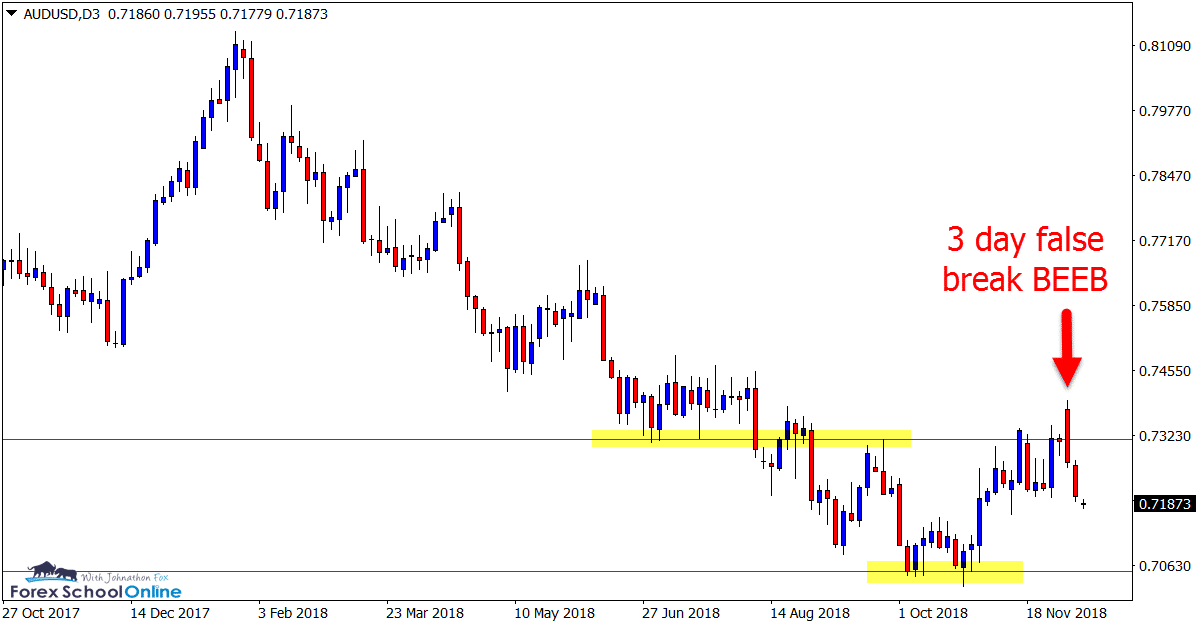
AUDUSD 3 Day Chart
3 Day False Break BEEB
In our recent charts in focus summary we discussed how price in this market had formed a base low and bounced higher.
In that summary price was moving into the major daily resistance for a big test of the move higher.
As the 3 day and daily charts show below; price attempted to break above the resistance, but was quickly rejected with price forming a large false break Bearish Engulfing Bar on the 3 day chart.
This market looks a little sideways now and a breakout and clear move either higher or lower would make things a lot clearer.
If you want to create 3 day candles on your New York close MT4 charts, or any other time frame including 6 hour, 8hr, 12 hour and 2 day charts, then download the free indicator here.
3 Day Chart
Daily Chart
GBPUSD Daily Chart
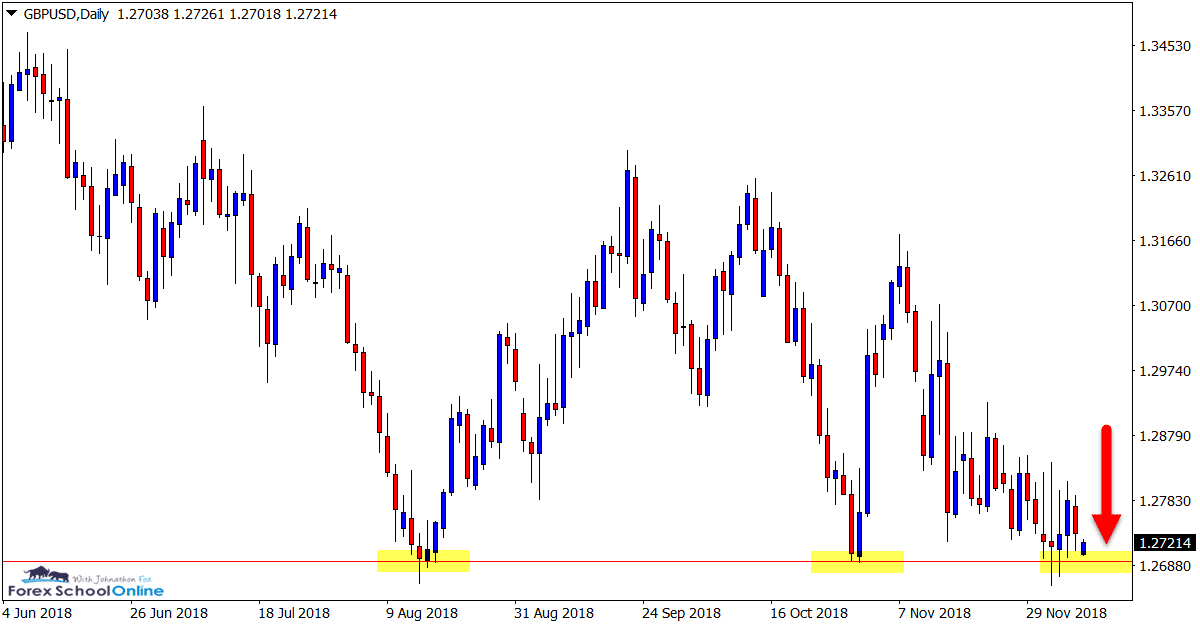
Big Test of Major Support
We have not discussed the GBPUSD for quite some time and that is because for quite some time it has not been doing much besides moving sideways in a range.
However; we can now see price is moving closer to the major daily support level.
This sets up for a very interesting test and potential breakout, opening a lot of trading opportunities.
If price can breakout lower and through this major support, we could see a hard and fast break. This would open up potential breakout trades and breakout and quick re-test setups on the smaller time frames.
Daily Chart
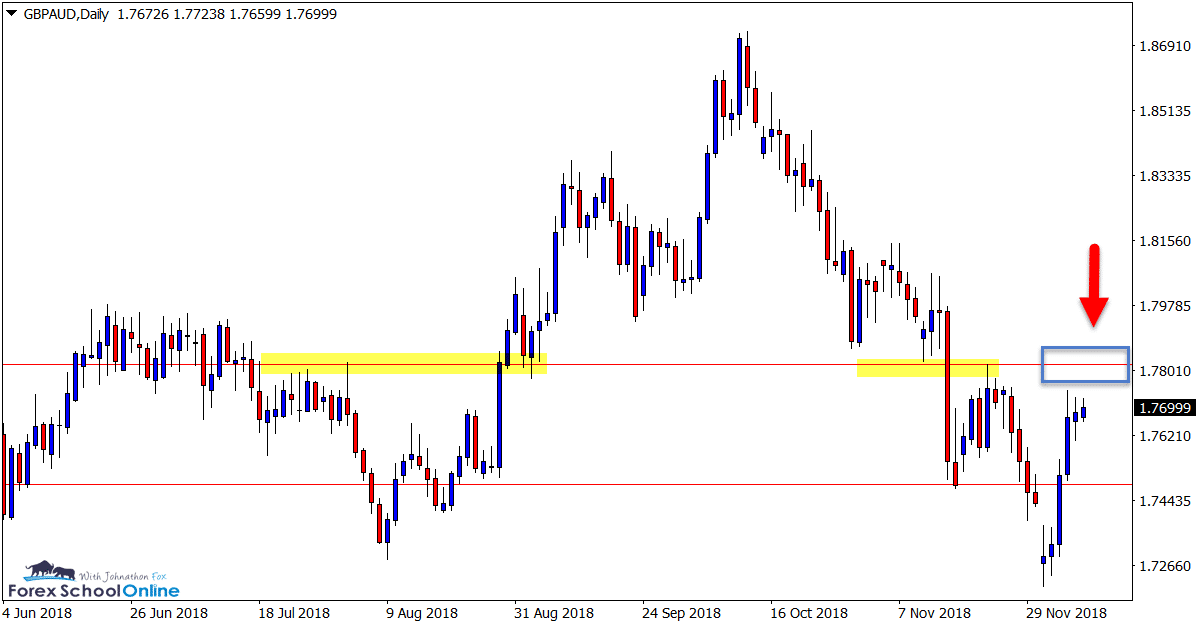
GBPAUD Daily Chart
Daily Resistance Coming up
Since early October price action in this pair has all been to the downside with price selling off heavily.
We can see in the last few days; as shown on the daily chart below that price has now rotated back higher.
If price continues and tests the overhead resistance, price action traders could watch for high probability short setups to see if price action is looking to continue this move lower and reject the major resistance level.
Traders could watch both the daily and smaller time frames for bearish price action clues.
Daily Chart
CADCHF Daily & 1 Hour Charts
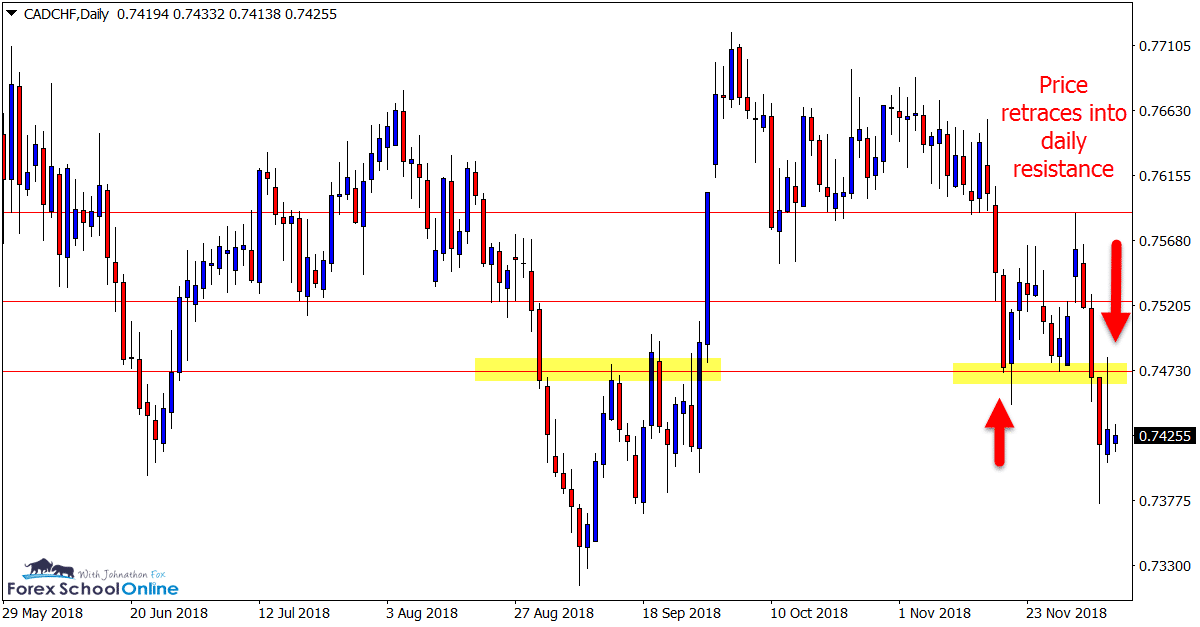
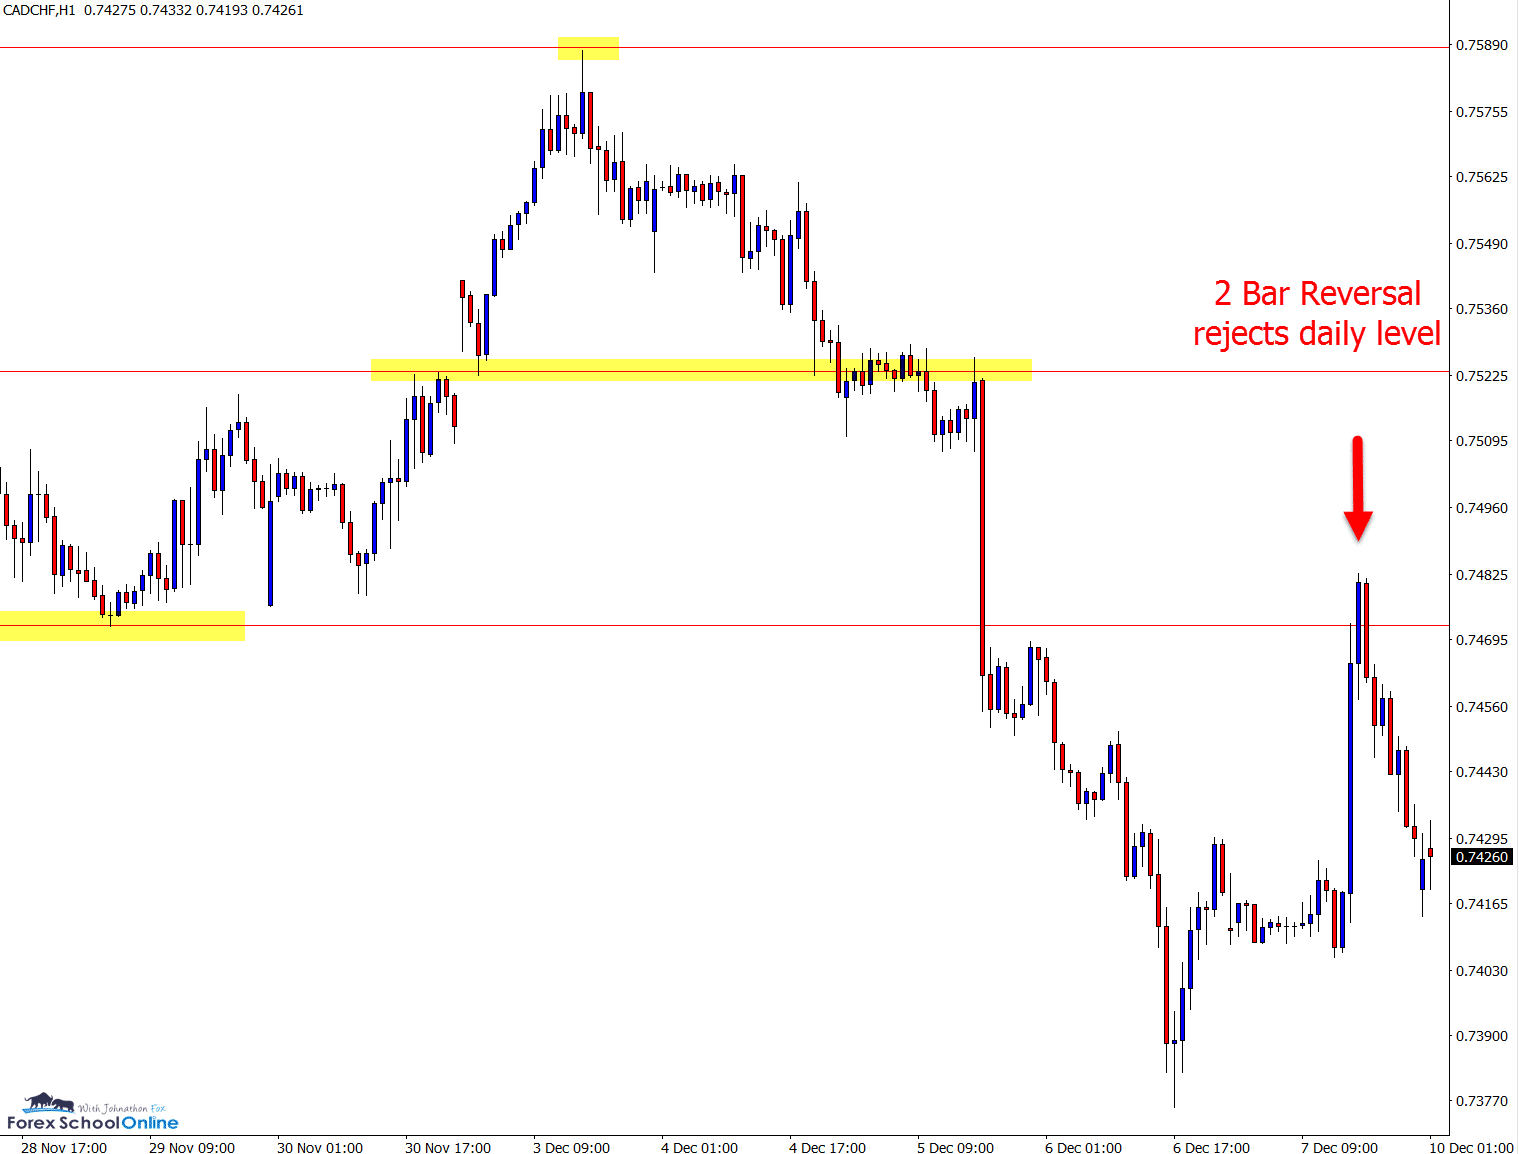
Price Flip And Trigger Repeats
In November’s price action summary we were looking for short trade setups in this pair at the quick price flip resistance level. Checkout the summary here.
Price did flip, reject and continue and has also continued to form the same pattern as so often occurs.
We can see price once again rolled over, moved to the downside, quickly retraced before forming a 2 bar reversal to reject the major daily price flip resistance.
Daily Chart
1 Hour Chart
Note: We Use Correct ‘New York Close 5 Day Charts’ – Download Free New York Close Demo Charts Here
Charts in Focus Note: All views, discussions and posts in the ‘charts in focus’ are the view of Forex School Online and are not recommendations or trading advice. All posts are general in nature and are not advice to buy or sell.
Please leave questions or comments in the comments section below;


Thanks mate👍
Your welcome Steve! 👍