Weekly Charts in Focus – 16th Oct 2018
Markets Discussed Today: AUDNZD, NZDUSD, EURNZD & NZDJPY.
AUDNZD Daily Chart
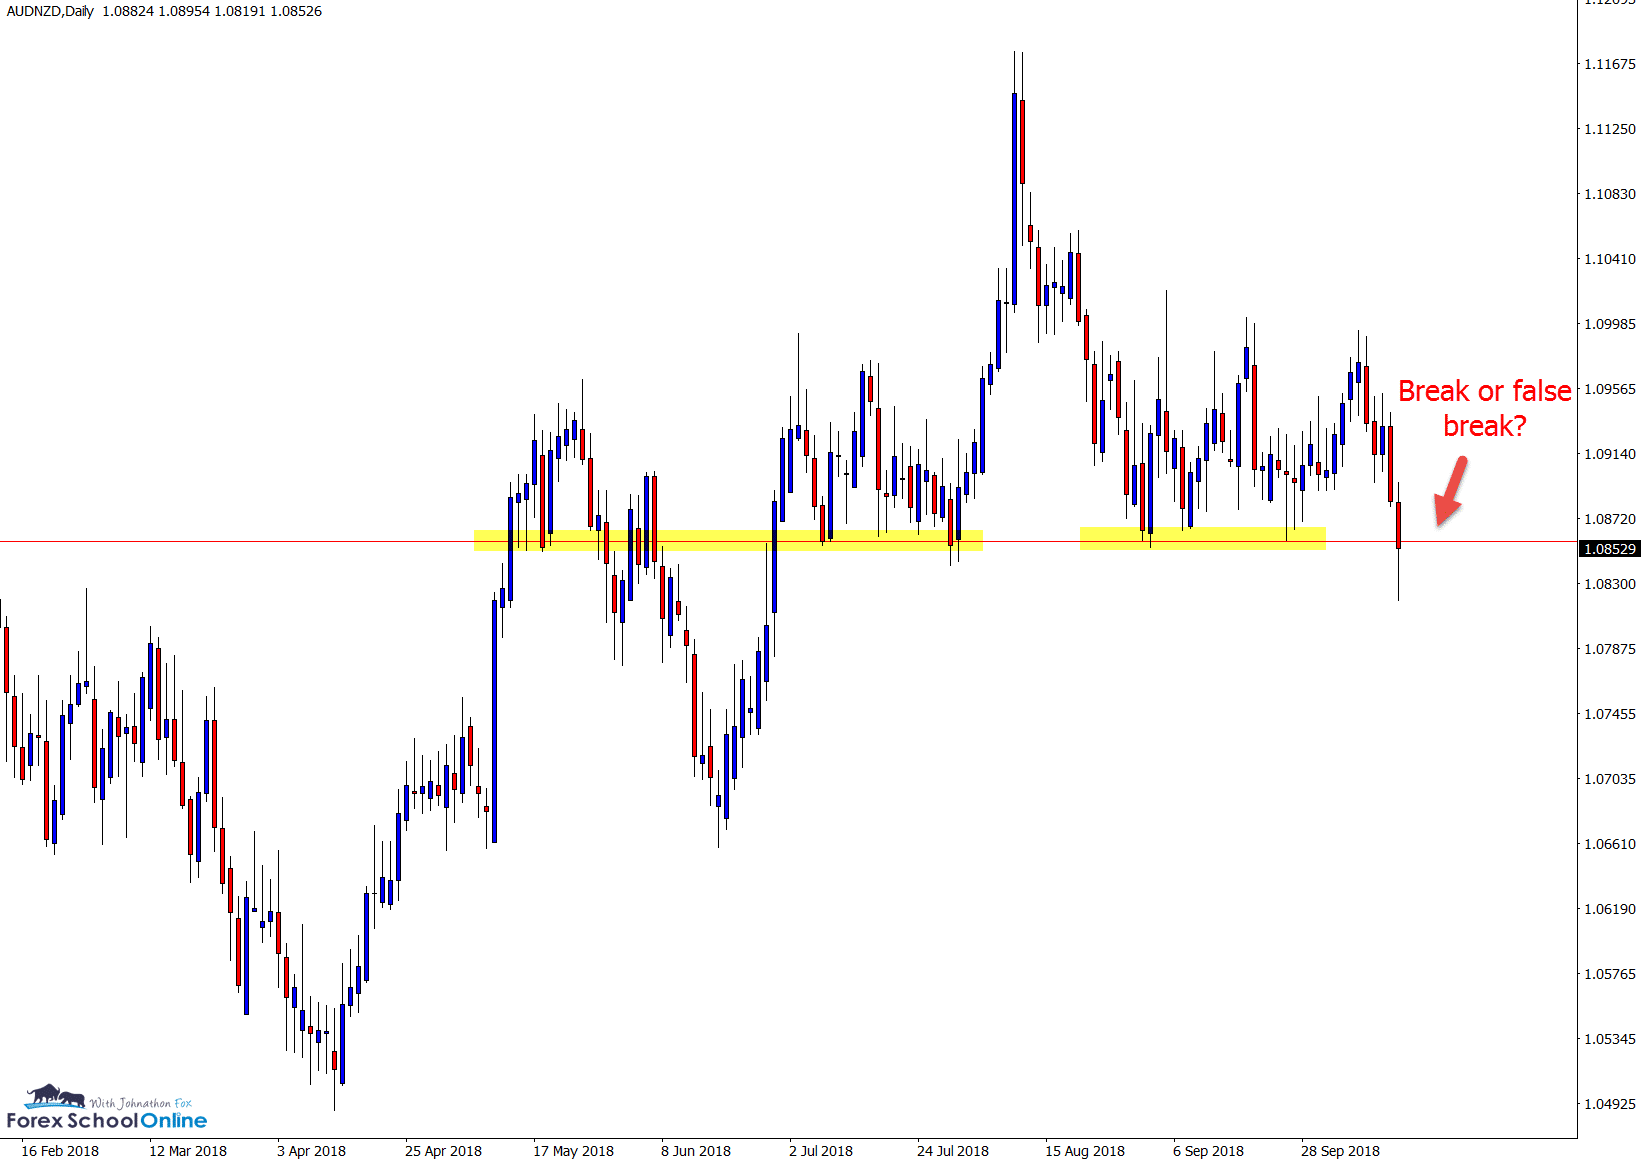
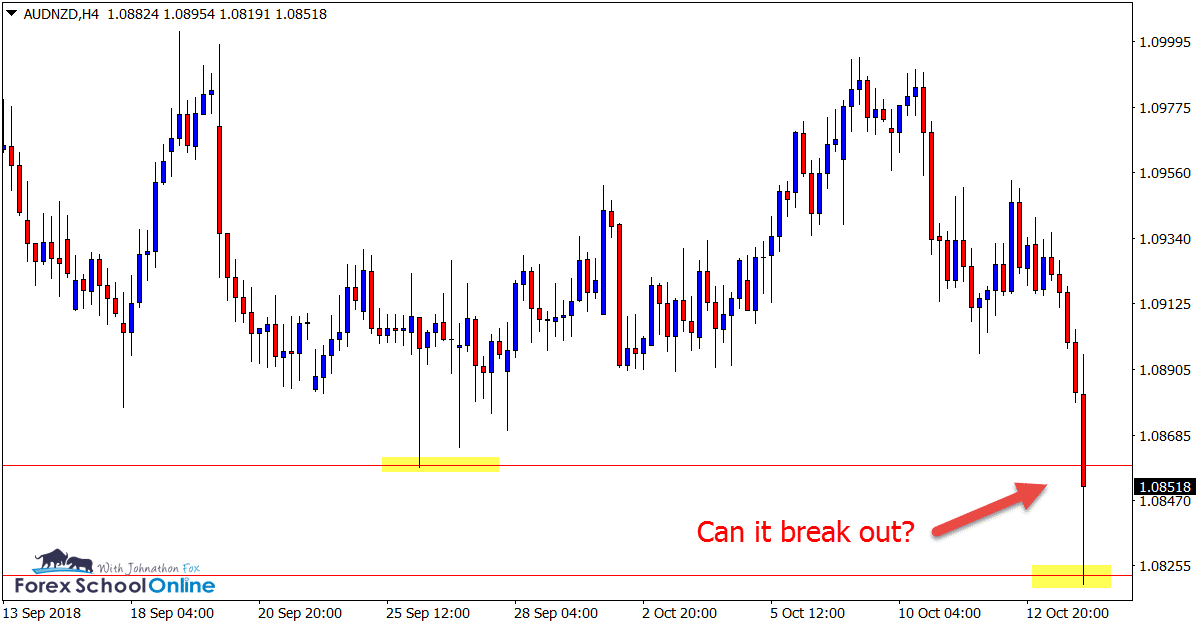
Price on the AUDNZD chart is attempting to make a breakout lower and through a major proven support level as I create this charts in focus post.
As you can see from the daily and four hour charts below; price has already broken lower during this session, but has since retreated to once again be above the support.
This support is a key level that goes back a lot of years. It also holds a lot of congestion. If price can successfully break lower, we could see a break of this tight range price has been stuck in of late and a little more free flowing movement.
NZDUSD Daily & Intraday Chart
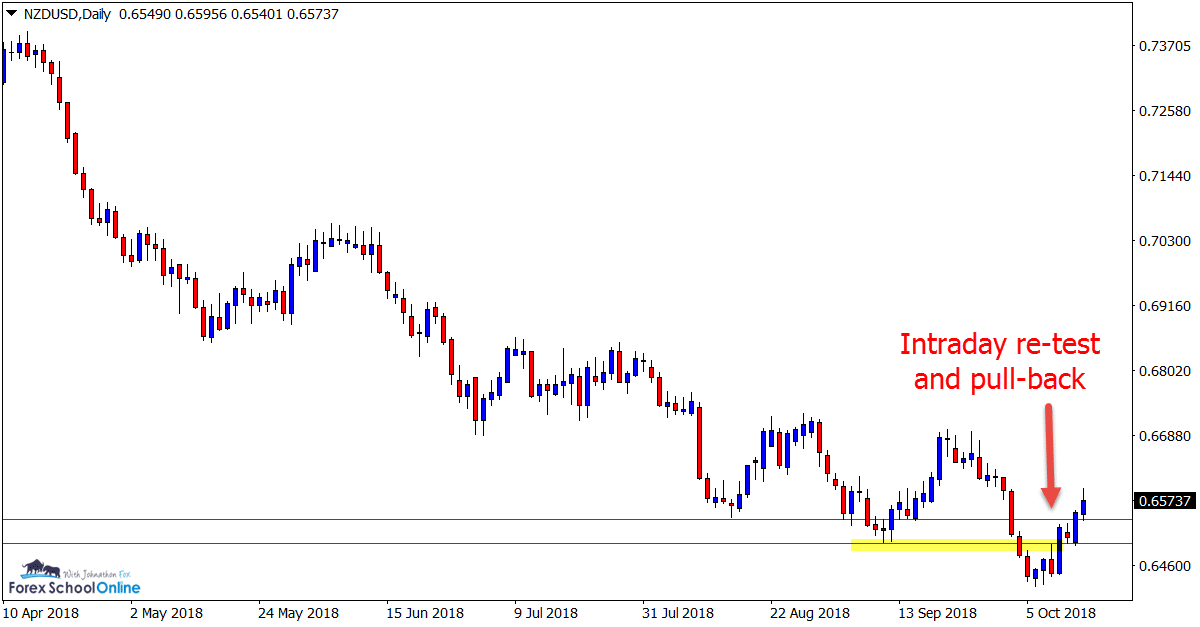
In the last ‘Charts in Focus’ Here we discussed the NZDUSD and how price was testing the support level and potentially about to make a break lower.
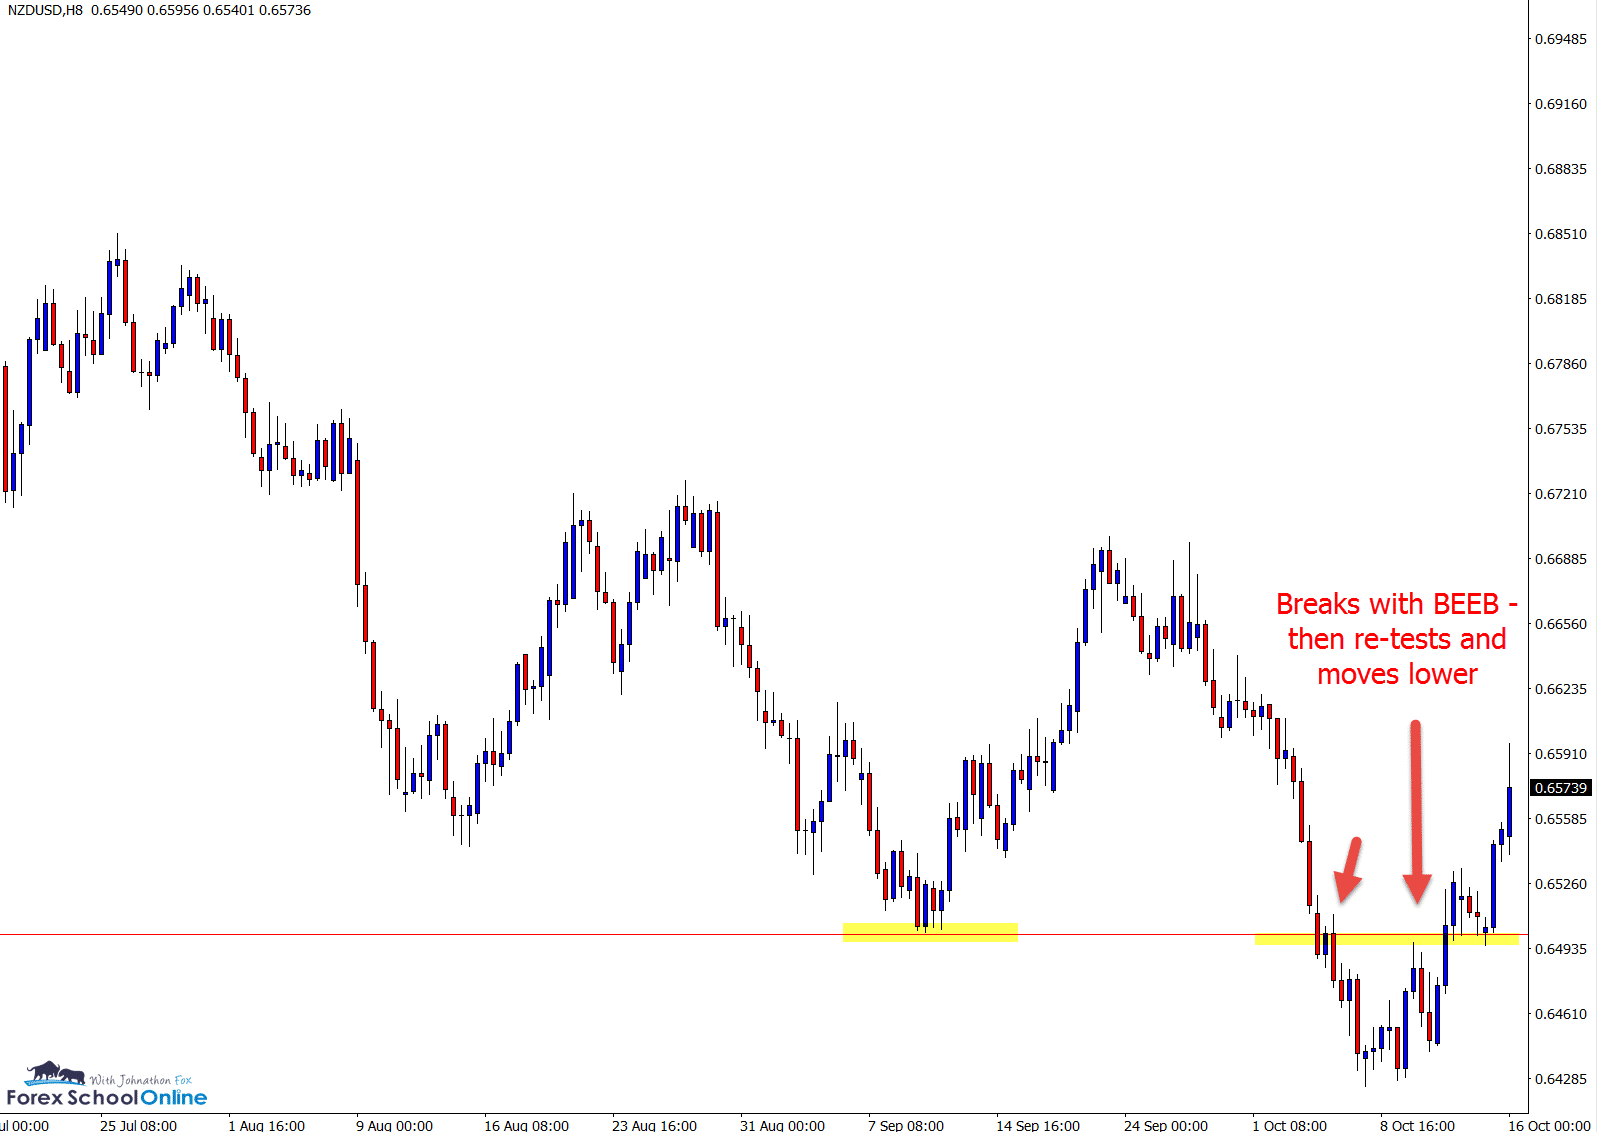
Price did end up making a break and moving lower smashing out with 4 hour and 8 hour engulfing bars.
On the intraday charts such as the 4 hour and 1 hour we saw price make a quick pull-back and re-test into the same price flip level, reject and sell lower, before price; turned and spun higher off the support. If you move to your 1 hour chart you will see this price action in motion.
NOTE: If you want to be able to create any time frame charts you like on your MT4 charts like the 8 hour time frame, then get this free MT4 time frame indicator here.
NZDJPY Daily Chart
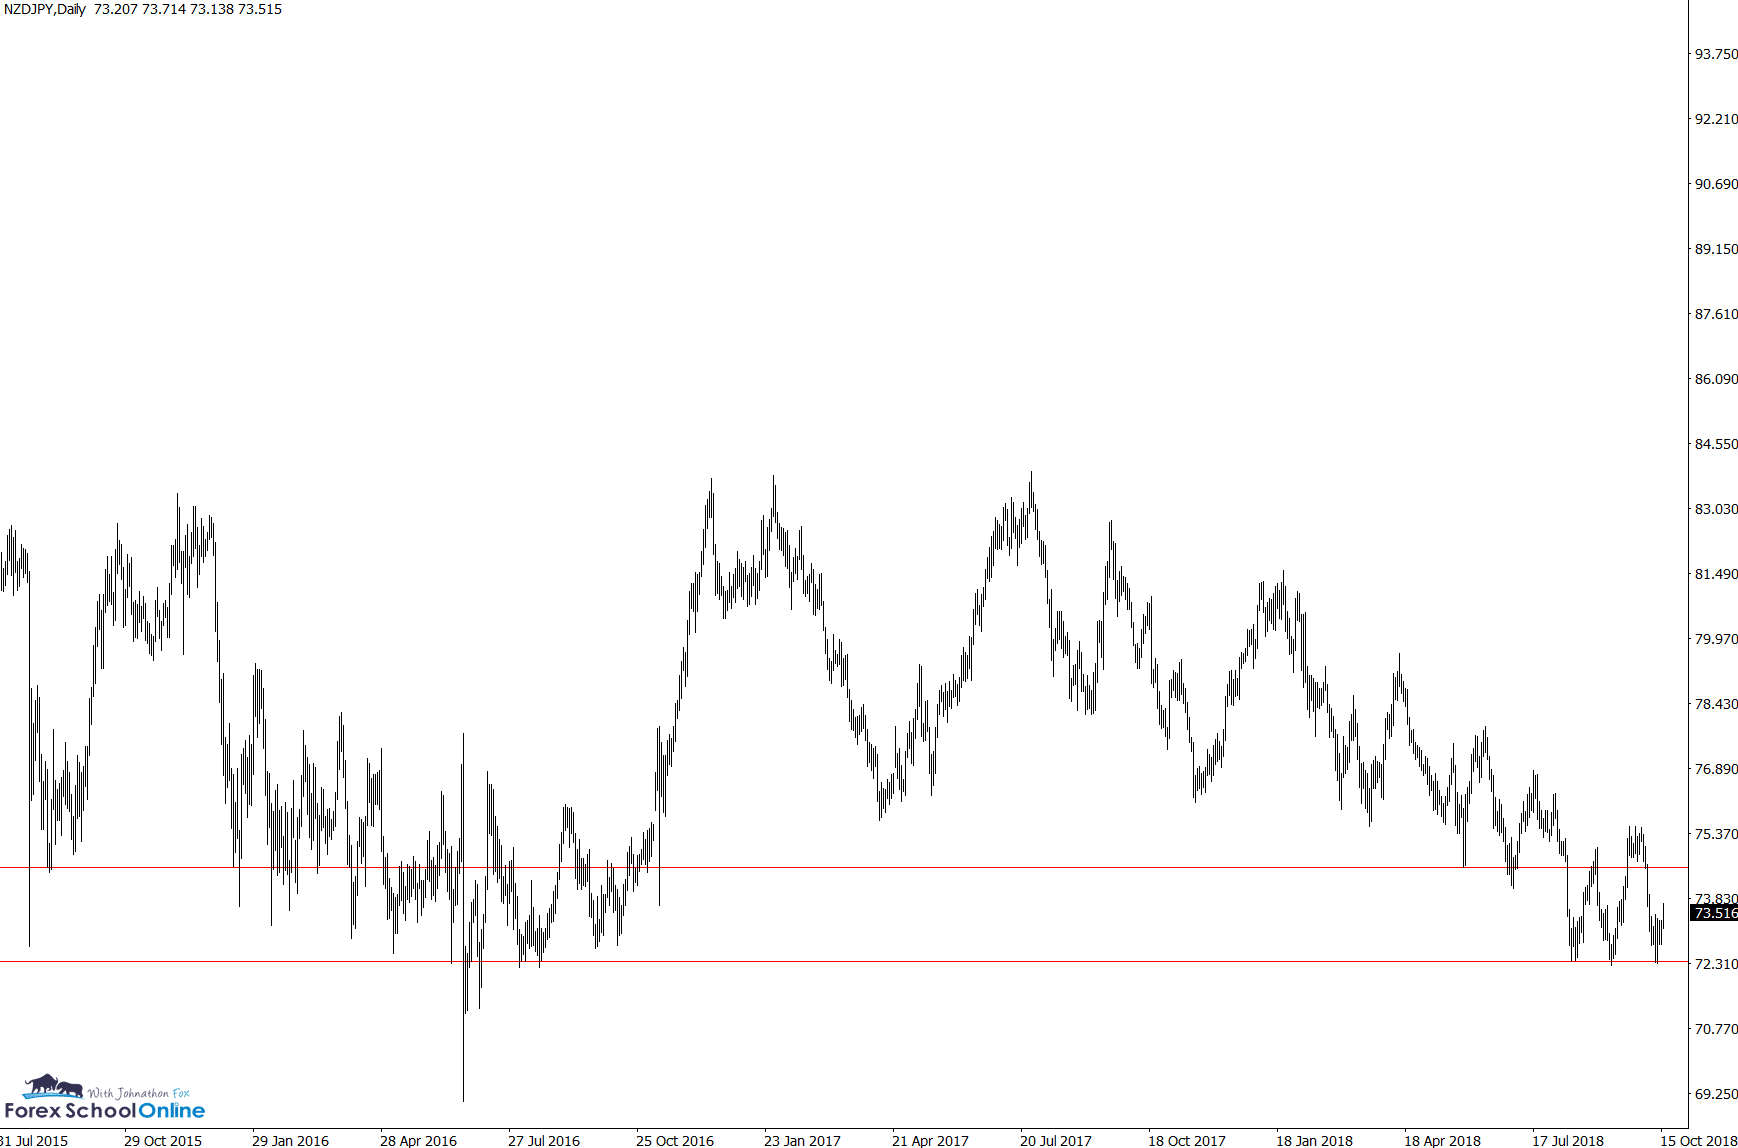
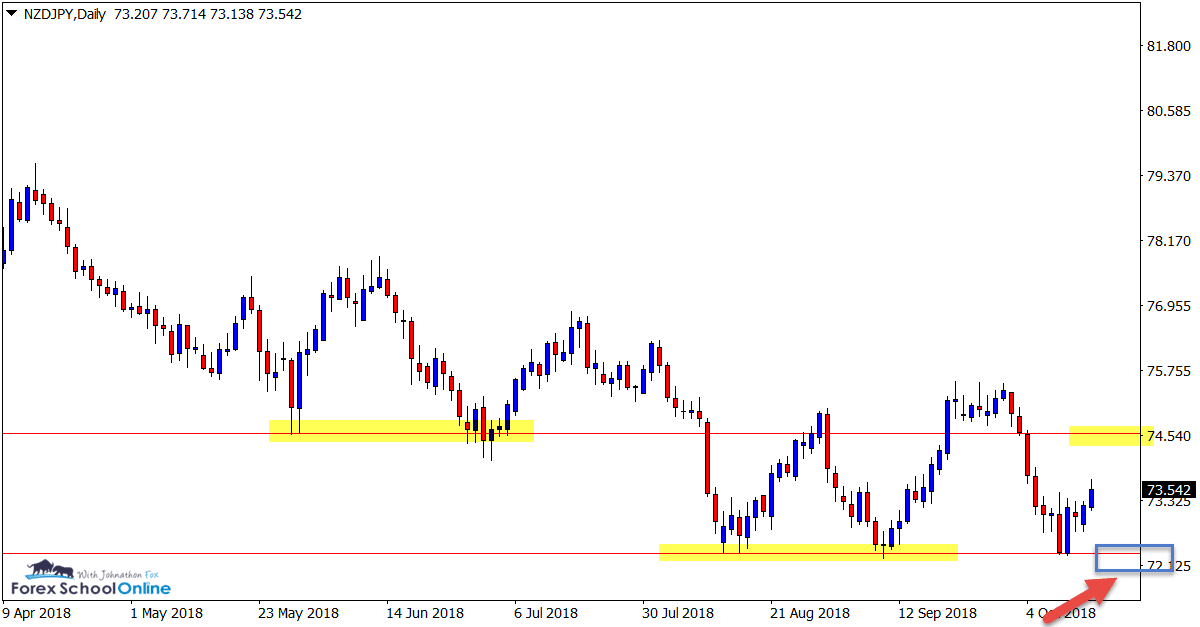
The NZDJPY is stuck in a large box that has a clear lower support level. If we zoom out we can see there are multiple minor levels (that often come when price is choppy or in a range).
Price is attempting now to move higher and back off this support level that it recently rejected back into what could be a resistance zone to watch.
Any major break of this key support could also open a lot of potential trading opportunities with breakouts or breakout and quick intraday re-test trades.
EURNZD Daily Chart
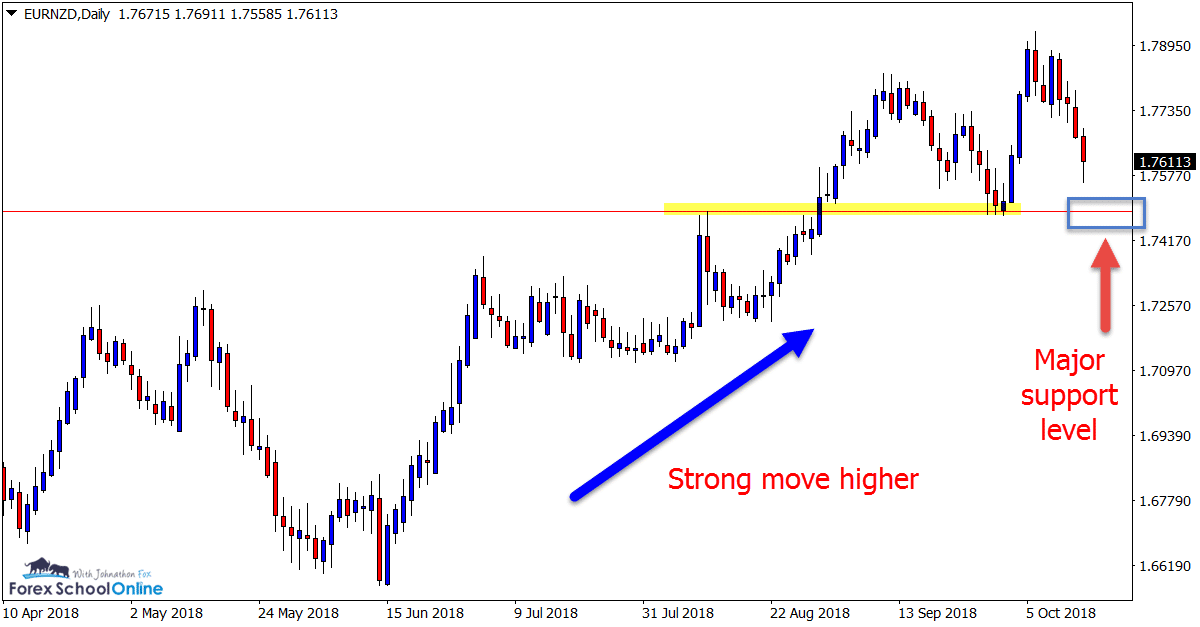
Price on the EURNZD has been in a strong move higher of late before this recent pause and reversal. If price does continue the move lower and into the major support area, then it will be testing a support level that has been tested multiple times over almost 15 years.
This could be a super interesting level to watch on the daily and intraday charts over the coming sessions.
Note: We Use Correct ‘New York Close 5 Day Charts’ – Download Free New York Close Demo Charts Here
Charts in Focus Note: All views, discussions and posts in the ‘charts in focus’ are the view of Forex School Online and are not recommendations or trading advice. All posts are general in nature and are not advice to buy or sell.
Please leave questions or comments in the comments section below;


I am a novice when it comes to trading, can you help me before i can start using real money?
Hi!
you can start at the start here or beginners course sections found here on main site and let us know if you get any questions.
https://www.forexschoolonline.com//new-forex-price-action-start/
Johnathon