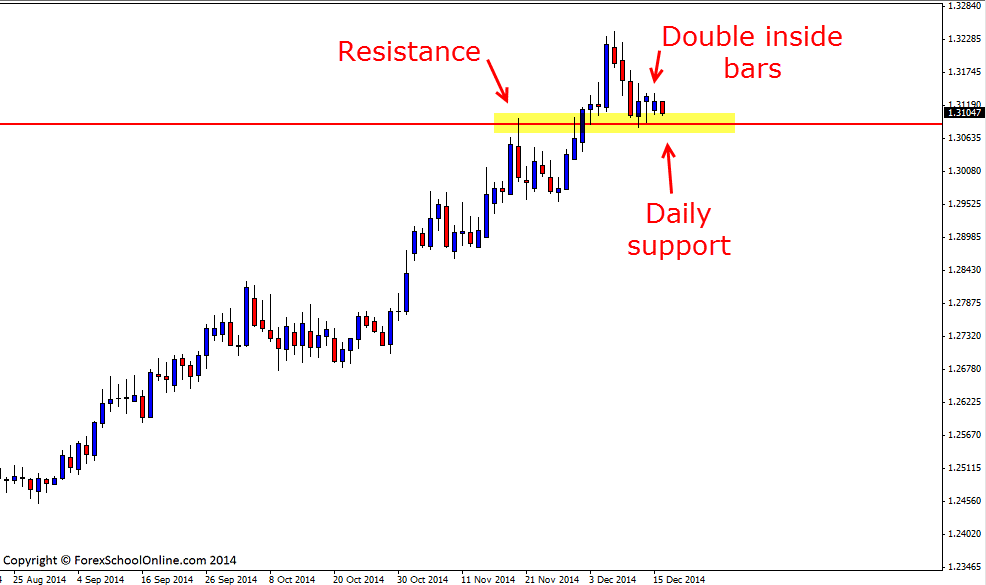
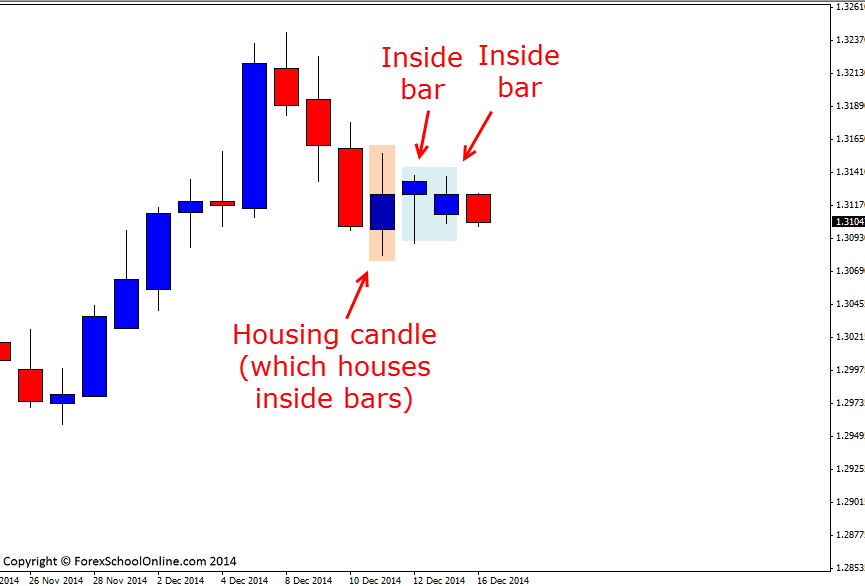
The USDSGD has started to wind-up on the daily chart with price forming double inside bars sitting just above a key daily support level. When price winds up like this it is a clue that pressure is building and the order flow is winding up and getting ready to make the next big push or move. Often the longer the wind up goes on for, the bigger the move or explosion will be when the breakout eventually happens.
This is especially common on intraday charts across different sessions. For example; price may stay contained within a really tight boundary through the Asian session and then the UK session on a 1 hour chart, but when price does eventually breakout from the containment in the US session, the breakout can be fast and aggressive.
Price has been in a strong up-trend of late on the daily chart, but has recently found a top and we can see on the daily chart below that price may now be trying to attempt at making a move lower. After rejecting the high and making the initial break lower, price paused at the support level and that is when price formed the inside bars. This is often how new moves are formed. It is super rare for price to just turn around on a dime and change a trend straight away. It takes time for the market to change momentum. What will often happen is a stagger sort of movement where price will make the initial break, then pause – this is where candles such as inside bars will form during the pause. Price will then gather more order flow and if price is going to change direction it will then make a break and continue with a break through the level.
For a change against the strong trend we would need to see a strong break and most importantly a close below the key level. This level is also a longer term support level. This could open a lot of short selling if this level does give way. At this stage the trend is still in play and the support still holds so any bullish trigger signals could still be looked upon as chances to get long with the trend cautiously.
KEEP AN EYE OUT: I will be releasing a trading lesson in the next two days that is super interesting and will help a lot of traders in their trading. This lesson is on a study that was carried out by the London School of Economics that focuses on professional traders and how they deal with emotions in their trading and how the best traders deal with them differently from the rest. It is very eye opening so keep an eye out.
USDSGD Daily Chart

USDSGD Daily Chart Inside Bars


Leave a Reply