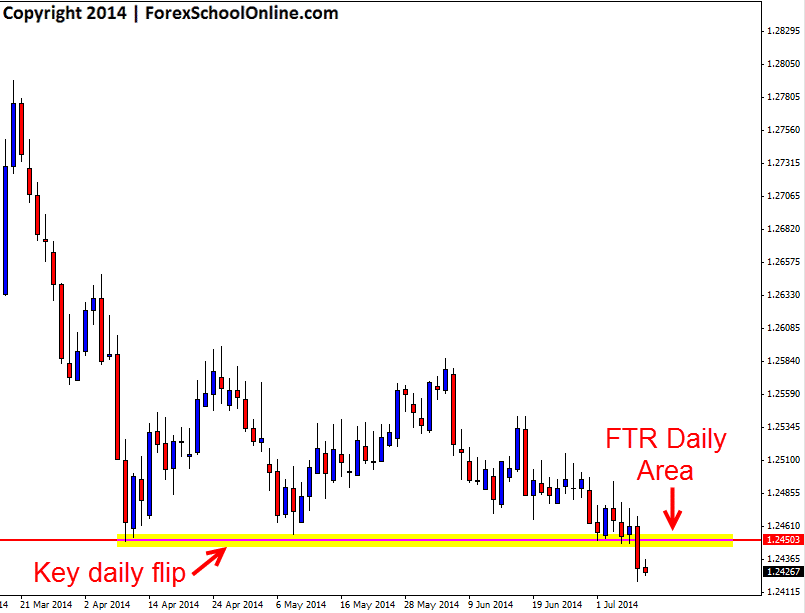
Price on the daily chart of the USDSGD has broken through a key daily support level and importantly closed below. This support level could now look to become an important price flip level and a new resistance should price move back higher and to look make a re-test. As I have just outlined in the new trading lesson First Test Support/Resistance Price Action Strategy when price breaks a key daily level like has just occurred here on the USDSGD, traders can then be on the lookout for a quick retrace back into that level for a price action trade on the smaller intraday time frames such as the 8hr, 4hr or 1hr etc, time frames.
Traders are not looking for a long breakaway from the level and then a move back into the new support/resistance in the coming weeks, but rather a quick break through the level and fast retracement into the same level in the next few days on the daily chart. When traders notice that price is making a quick retracement back into the key daily level they can then move down onto their intraday charts to look for a setup. The reason traders will move onto their intraday charts is because the intraday charts offer a lot more space to make a trade the daily charts don’t. Whilst making the trade from the intraday chart is still trading from a key daily level, there is then more space to make the trade.
If price can move back higher and into the key daily price flip level on the USDGSD it could provide a good opportunity for traders to look for short trades at this first test back to resistance or the First Test Resistance (FTR). For any potential short trades there would need to be high probability price action trigger signals fired off like the ones taught in the Forex School Online Price Action Course.
Daily USDSGD Chart


Leave a Reply