The USDJPY price stays above the EMAs as the bulls took to gain the market momentum.
Buyers may put in their aggressive orders at key areas.
USDJPY Weekly Price Analysis – February 11
An increase in bulls’ pressure may push the market price of USDJPY further to the $116.352 resistance level.
USDJPY Market
Key Levels:
Resistance levels: $116.150, $116.250, $116.350
Support levels: $113.600, $113.450, $113.300
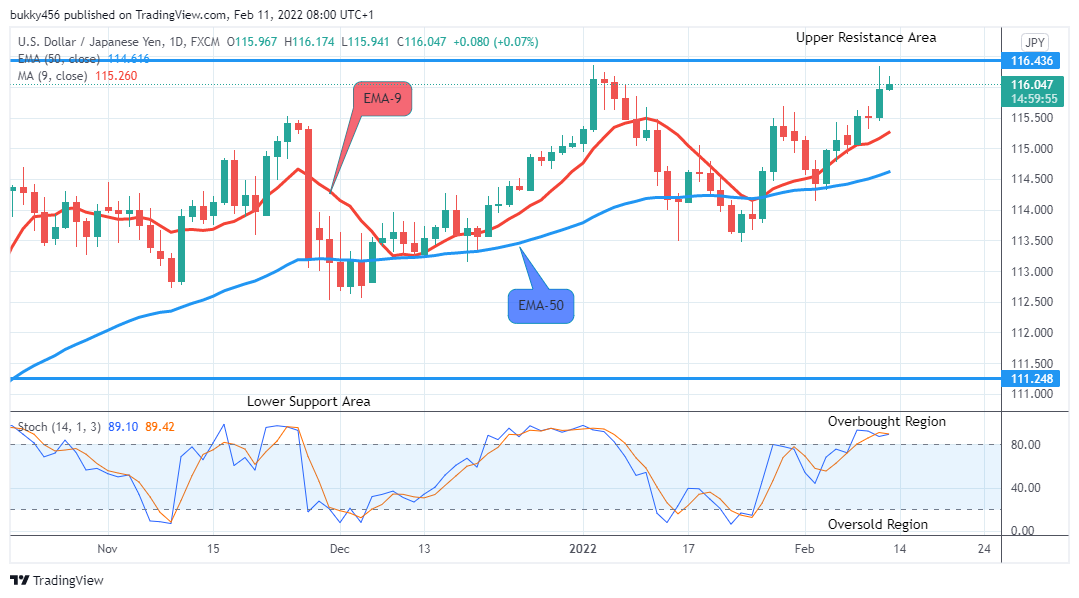
USDJPY Long-term Trend: Bullish The currency pair looks tasty for the bulls here in the long-term outlook as can be seen from the chart. The bullish pressure at $116.338 in the resistance area above the EMAs moved the Yen up and sustained it through yesterday’s session as the bulls takes over the market.
The daily chart opens today on a bullish note at $115.967 in the resistance area. Increased momentum by the bulls moves the price further up to $116.045 in the resistance area.
The price of USDJPY is initially up now at $116.174 above the two EMAs in the resistance area an indication that the price of the Yen is in an uptrend.
The stochastic oscillator signal pointing up at around level 90% in the overbought region indicates that the price movement is in an uptrend and sellers are expected to emerge soon in the days ahead in the long-term. Hence, buyer’s relief.
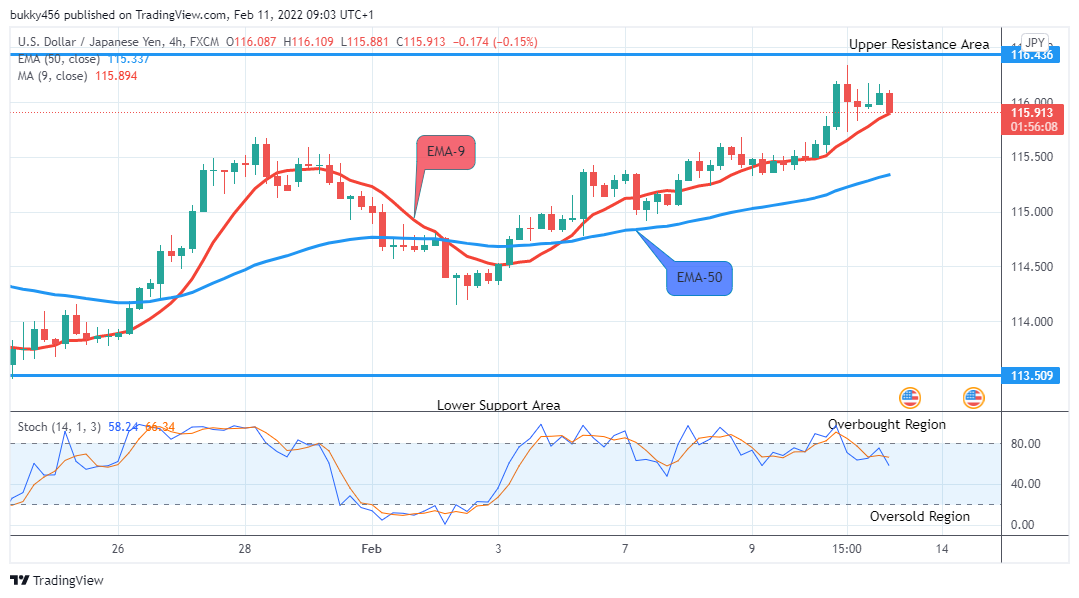
USDJPY Medium-term Trend: Bullish On the 4-hour chart, the currency pair is in an upward trend zone. The moving averages are sloping upward indicating the uptrend.
The sustained bullish pressure pushes the pair further up at the $116.174 resistance level during yesterday’s session.
Today’s 4-hourly chart opens with a bullish candle at $115.985 in the resistance area as the bulls continue to dictate the market.
Activities from the buyers further move the currency pair up to the $116.169 resistance level before the momentum is lost.
The sellers in-road to the market dropped the market value of USDJPY down to $115.987 support level.
The price of USDJPY is initially down at $115.940 in the support area above the two EMAs, this indicates that more buyers are in the market at the present.
The signal of the stochastic oscillator signal points down at around level 58% in the overbought region. It suggests the overall outlook shows upward momentum while a temporary drawdown may occur within the range in the days ahead in the medium-term.
Note: Forexschoolonline.com is not a financial advisor. Do your research before investing your funds in any financial asset or presented product or event. We are not responsible for your investing results.


Leave a Reply