USDJPY keeps fluctuating above $113.569 level.
Overall market sentiment regarding the pair remains bullish.
USDJPY Weekly Price Analysis – December 21
USDJPY is now strongly trading above the EMAs,and this could lead to more growth for the buyers.
USDJPY Market
Key Levels:
Resistance levels: $114.200, $114.250, $114.300
Support levels: $112.500, $112.450, $112.400
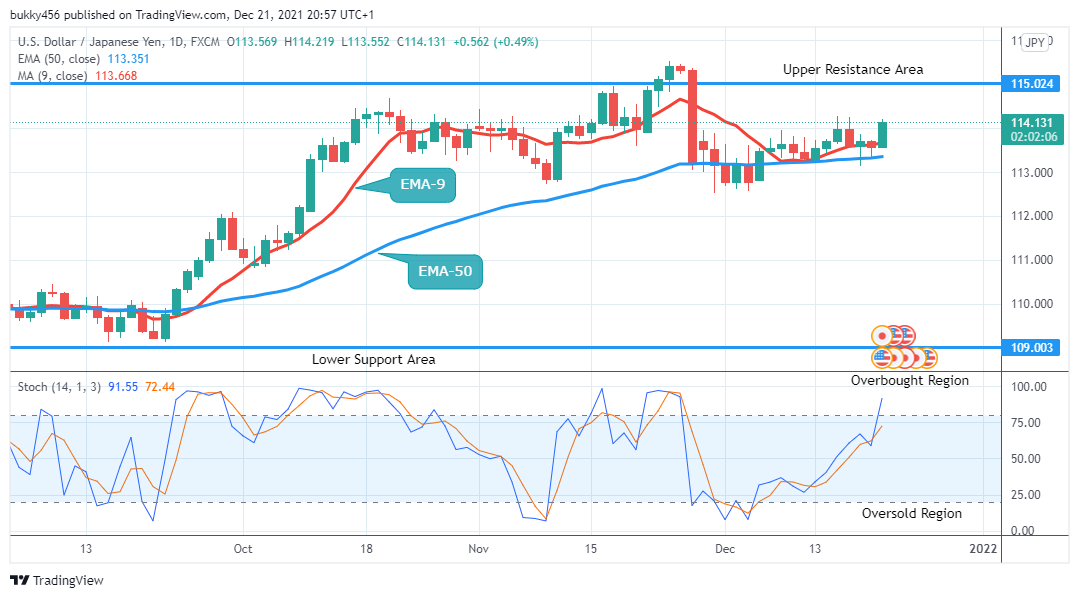
USDJPY Long-term Trend: Bullish The currency pair looks bullish in its long-term perspective. The bears increased momentum dropped the price down to $113.326 in the support area, during yesterday’s session, the momentum was lost as the buyers took over from there.
Today’s daily chart opens with a bullish candle at $113.569 in the resistance areas the bulls resume the trend.
The buyer’s increase momentum further moves the price of USDJPY up to $114.124 in the resistance area.
Price is initially up at $114.219 in the resistance area above the two EMAs, an indication of an uptrend in the context of the strength.
The signal of the stochastic oscillator points up at around level 91% in the overbought region, suggesting an upward momentum in the price of the Yen also the price may likely encounter a change in trend in the days ahead in the long-term perspective, as sellers may emerge soon.
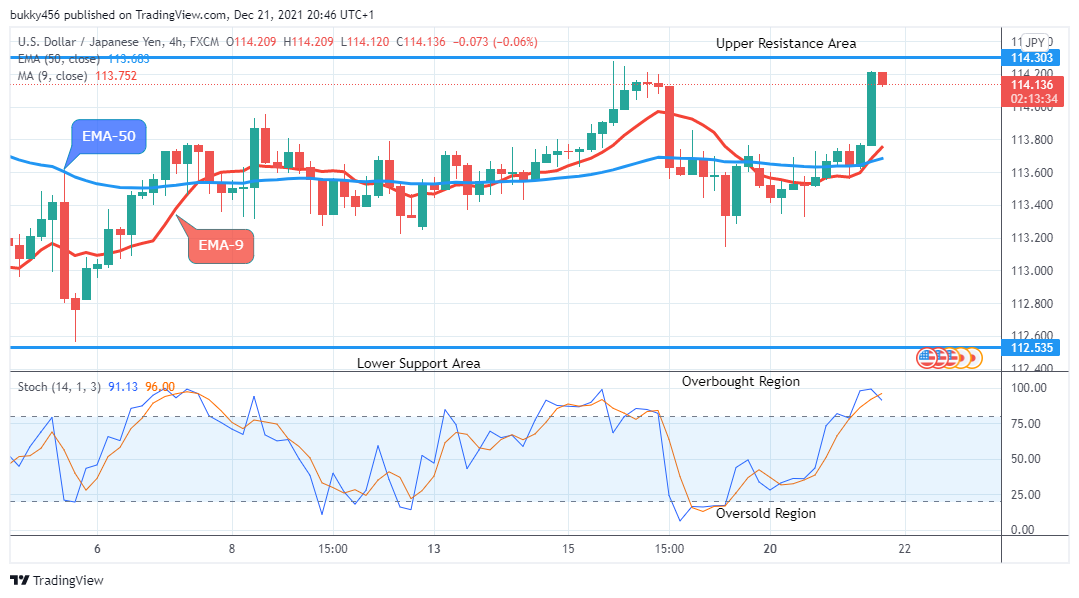
USDJPY Medium-term Trend: Bullish The Yen is in a bullish trend market in its medium-term outlook. The buyer’s impulsive movement at $113.708 breaking the two EMAs up with its wick in the resistance area pushed the currency pair into a bullish market and sustained it during yesterday’s session.
The journey to the north continues as today’s 4-hourly chart opens at $113.667 in the resistance area.
The bear comes in briefly and drops the price of the Yen down to $113.555 in the support area.
The bulls return and move the price of USDJPY up to $114.249 with a long bullish candle at the resistance area.
The price of USDJPY is initially down at $114.120 in the support area which is above the two EMAs, an indication of an upward trend in the context of the strength of the market.
However, the stochastic oscillator signal pointing downwards at around level 89% in the over-bought region is an indication that the market is likely to encounter more downsides in the latter days in the medium-term perspective.
Note: Forexschoolonline.com is not a financial advisor. Do your research before investing your funds in any financial asset or presented product or event. We are not responsible for your investing results.


Leave a Reply