The currency pair is on ranging movement in the long-term while the medium-term outlook is in a bearish move.
Patience is needed to either wait for a bullish movement before taking a long position or a bearish movement before taking a short position.
USDJPY Weekly Price Analysis – September 10
Further increase in the bears’ pressure may break down at $108.500 level and this may decrease the price to $108.100 and $108.095.
USDJPY Market
Key Levels:
Resistance levels: $109.700, $109.720, $109.725
Support levels: $108.100, $108.095, $108.090
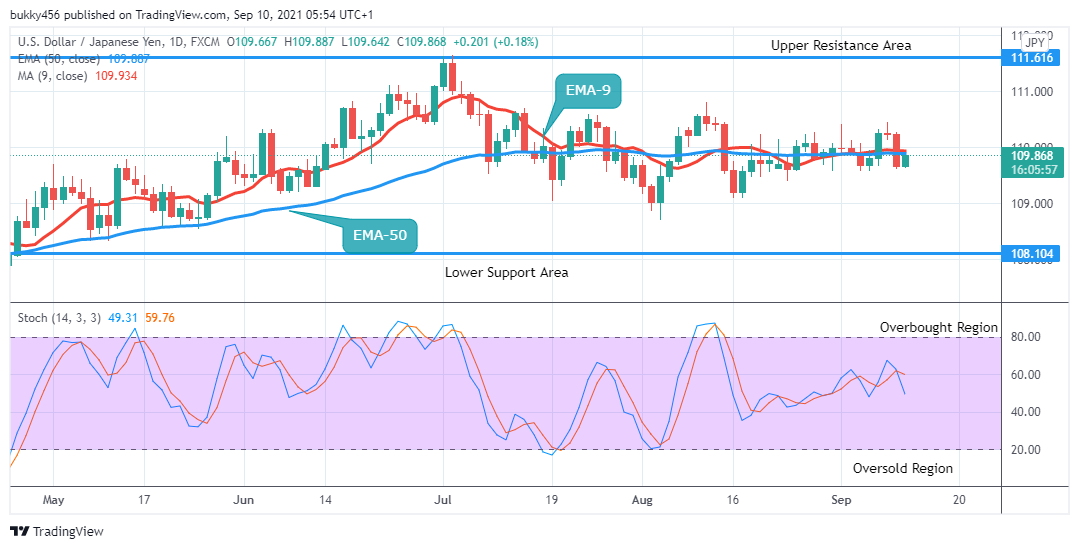
USDJPY Long-term Trend: Ranging USDJPY is on the ranging movement in its long-term outlook. The bulls and the bears are at the equilibrium level on the daily chart.
The bears have been trying to break down the support level of $108 but could not. The bulls are also trying to break up the resistance level of $109 but the level holds.
The bears manage to push the price down to $109.621 in the support area as the low during yesterday’s session as the currency pair continues consolidation.
A bullish candle at $109.667 in the resistance area with its wick touching the two EMAs opens today’s daily chart within the range.
The price is initially up at $109.877 in the resistance area which is below the two EMAs and the stochastic oscillator signal pointing down at around level 60%, an indication of downward momentum within the range in the long term.
USDJPY is ranging and trading between $111.600 in the upper resistance area and $108.350 in the lower support area of the range. Patience coupled with a retest is needed before a position is taken.
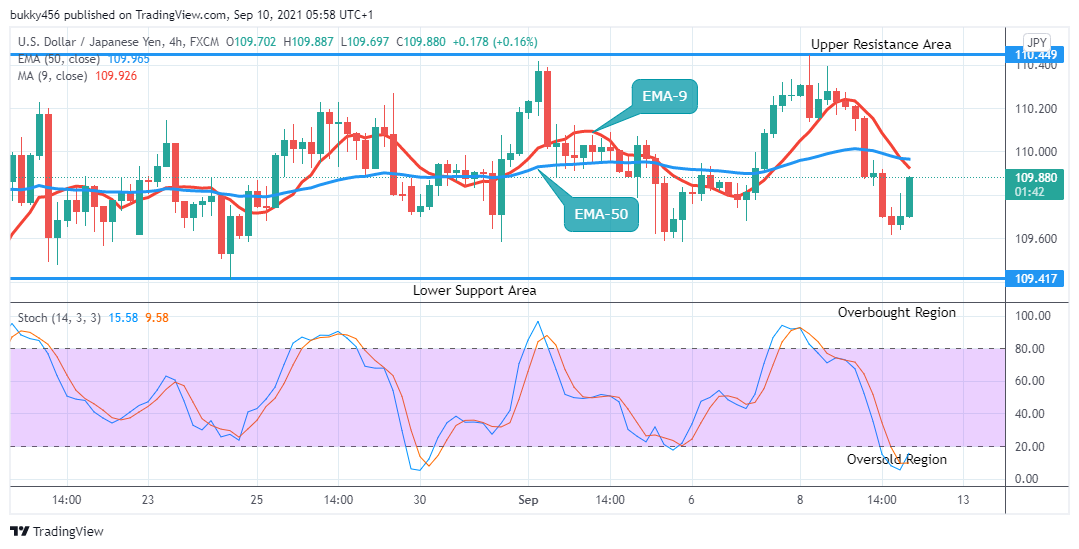
USDJPY Medium-term Trend: Bearish On the medium-term outlook, the pair is in a downtrend. The pair faces rejection at level $110.171 as the Pound resumed a downward move
Today’s 4-hourly chart opens with a bullish candle at $109.702 in the resistance area.
The price further rises to $109.887 in the resistance area which is below the two EMAs. The pound has fallen into the oversold region of the market. Buyers are expected to emerge. The EMA-9 and EMA-50 are sloping downward indicating the downtrend.
The USDJPY pair is around level 24% range of the daily stochastic in an upward direction in the oversold region, this suggests that the pair might likely encounter a change in trend in the nearby days in the medium-term.
Note: Forexschoolonline.com is not a financial advisor. Do your research before investing your funds in any financial asset or presented product or event. We are not responsible for your investing results.


Leave a Reply