The currency pair remains in a bullish market zone.
Buyers still dominating the market slightly.
USDJPY Weekly Price Analysis – February 25
The price may continue its bearish movement if the daily candle closes below the $114.148 support level, the support levels of $113.669 and $113.659 may be the target.
USDJPY Market
Key Levels:
Resistance levels: $115.700, $115.750, $115.800
Support levels: $115.149, $115.049, $114.949
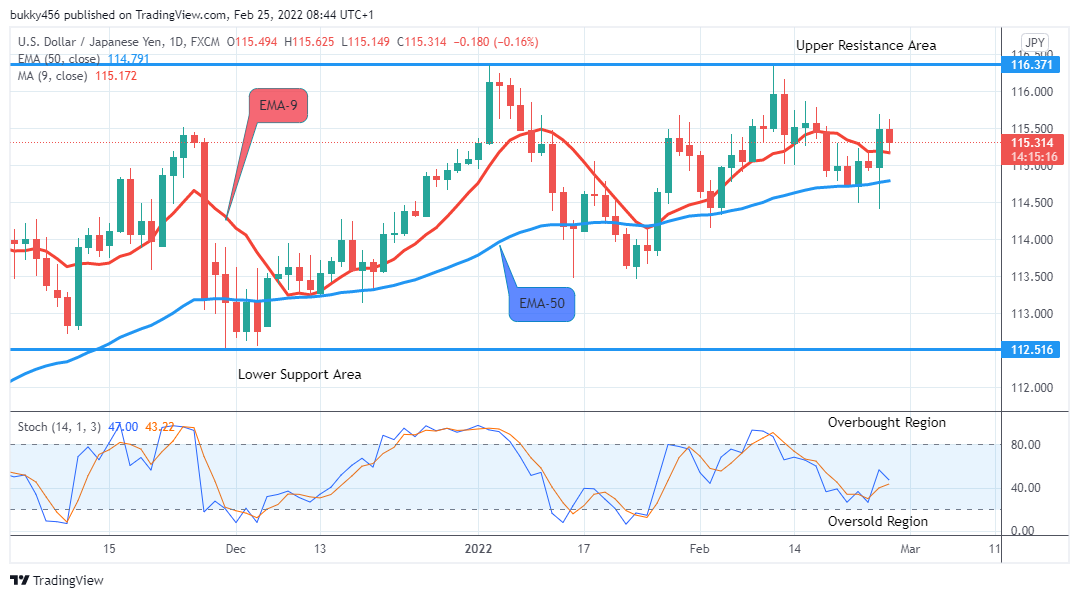
USDJPY Long-term Trend: Bullish The currency pair is bullish on the daily chart. The bullish momentum has pushed the Yen to find resistance at the $115.695 price level during yesterday’s session.
From here, the bears started to step back in and pushed the market lower to $115.494 as the daily chart opens today.
Increased momentum by the bears drops the price further down to the $115.325 support level.
The current market price at the $115.149 support level which is above the two EMAs suggests that the bulls are getting weaker and the bears are trying to in-road the market gradually.
The momentum indicator shows that the price signal is also moving downwards at around level 45% moving towards the overbought region, indicating that USDJPY may continue the downward trend in the days ahead in the long-term perspective.
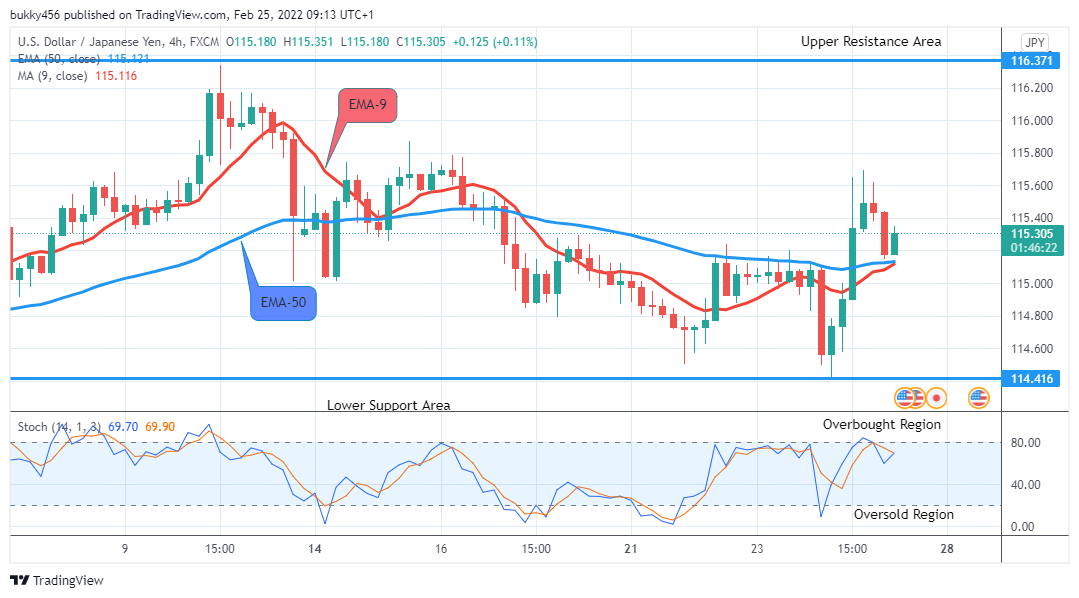
USDJPY Medium-term Trend: Bullish On the 4-hour chart, the currency pair is in an upward trend zone. The sustained bullish pressure pushes the pair further up at the $116.695 resistance level after which the bulls lost the momentum and the bears came in and dropped the price down to $115.384 before the end of yesterday’s session.
Today’s 4-hourly chart opens with a bearish candle at a $115.438 support level as the sellers continue with the trend.
Activities from the sellers drop the market price of USDJPY further down to the $115.149 support level.
The momentum was lost while the bulls were in-road briefly and moved the market price of the Yen up to the $115.279 resistance level.
The price of the USDJPY pair is currently trading at a $115.351 resistance level above the two EMAs which are glued together; this implies that the momentum in the price of the Yen is in an uptrend.
The signal of the stochastic oscillator signal points up at around level 68% approaching the overbought region. It suggests the overall outlook shows upward momentum and may likely commence a bearish movement soon in the nearby days in the medium term.
Hence, sellers need to wait for this action to take place before placing their orders at key areas.
Note: Forexschoolonline.com is not a financial advisor. Do your research before investing your funds in any financial asset or presented product or event. We are not responsible for your investing results.


Leave a Reply