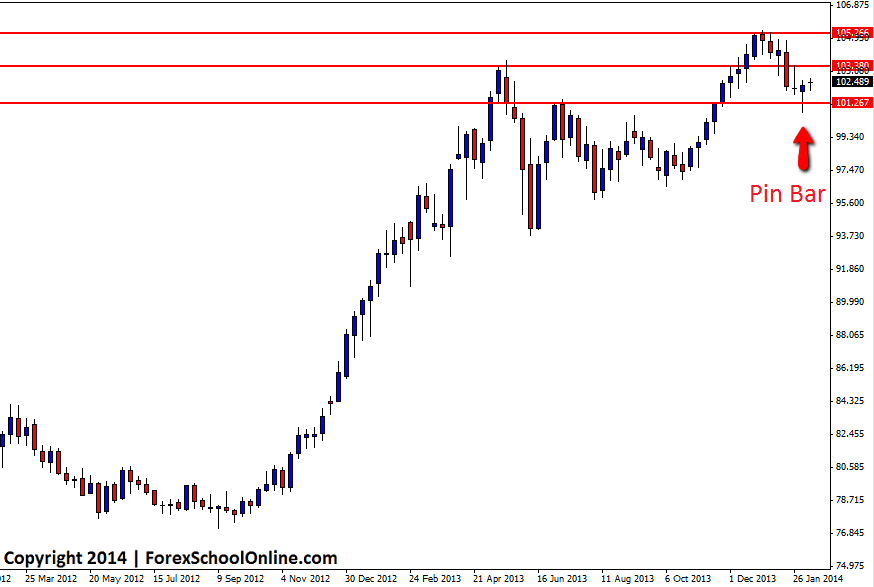
The USDJPY has fired off a Pin Bar on the weekly price action chart. This pin bar is small when comparing to the very best of pin bars, however it is rejecting a key weekly support level. Price over the longer term on this pair has been in an up-trend on the weekly chart for almost 18 months with price climbing over 2,800 pips at one stage, before in recent times falling off the highs and moving back into support.
Since price has found it’s high, it has looked to roll over to the downside with a quick decisive move lower on the weekly chart and some bearish signs on the daily chart including 2 x Bearish Engulfing Bars (BEEB) and a break of an important support level.
If price can break the Pin Bars high and make a push higher, it will then make it’s first move into the near term resistance of importance. This new resistance area could act as a strong area on the daily chart or intraday charts for new short trades if price has rolled over and created a new momentum to the downside. High probability bearish price action would need to present at this level to confirm this new resistance, otherwise this weekly up-trend could look to stay intact and push price further higher.
USDJPY Weekly Chart

USDJPY Daily Chart


Leave a Reply