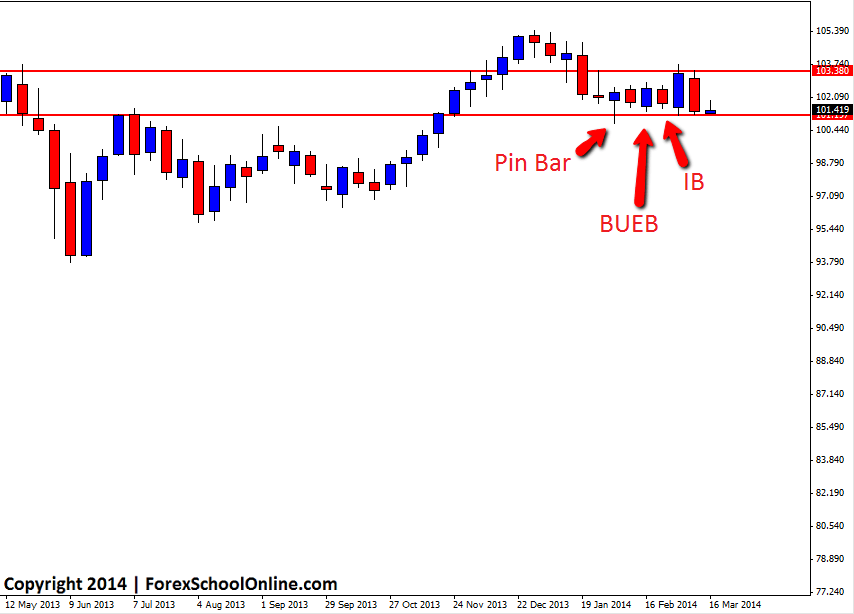
On the 13th of March I posted to this blog a pin bar that had just formed live on the weekly chart of the USDJPY. You can read the original post here: USDJPY Fires Off Weekly Pin Bar Reversal. This pin bar had formed rejecting a key weekly support level and was also in-line with the strong long term and short term trends that had been moving higher.
It took some time for price to confirm the pin bar and then gain momentum and move higher. After the pin bar, price went on to form both another Bullish Engulfing Bar (BUEB) and Inside Bar (IB), before price eventually then short higher after the inside bar.
After price broke higher, it moved into the crucial near term support area that was discussed in the original blog post. In the original blog post it was suggested that traders could watch their daily and intraday charts at this key resistance to see if any solid price action setups presented to take short trades. No quality price action presented except for a bearish rejection candle on the daily chart that was rejecting the key resistance, but price has now smashed lower and back into support all the same.
From here it would not surprise at all to see price move into consolidation and range trade sideways for a period of time. It is very important that traders trade the market that is currently in front of them and at the moment price on the daily chart is in a sideways trading period. The best way to play this pair could be to look to make trades from the key highs or low of the sideways range or sit tight and look for a breakout either way.
USDJPY Weekly Chart

Related Forex Trading Articles & Videos


Leave a Reply