USDJPY is preparing for the next bearish trend, a breakdown is imminent.
Sellers may be more relevant in the market soon.
USDJPY Weekly Price Analysis – November 3
There is a possibility for the USDJPY pair to face more downsides to continue its bearish movement if the bears could add more strength to their selling forces and breakdown the $137.92 support value and close the daily candle, the lower support level of $135.00 may be the target.
USDJPY Market
Key Levels:
Resistance levels: $145.00, $146.00, $147.00
Support levels: $140.00, $139.00, $138.00
USDJPY Long-term Trend: Bullish (Daily Chart)
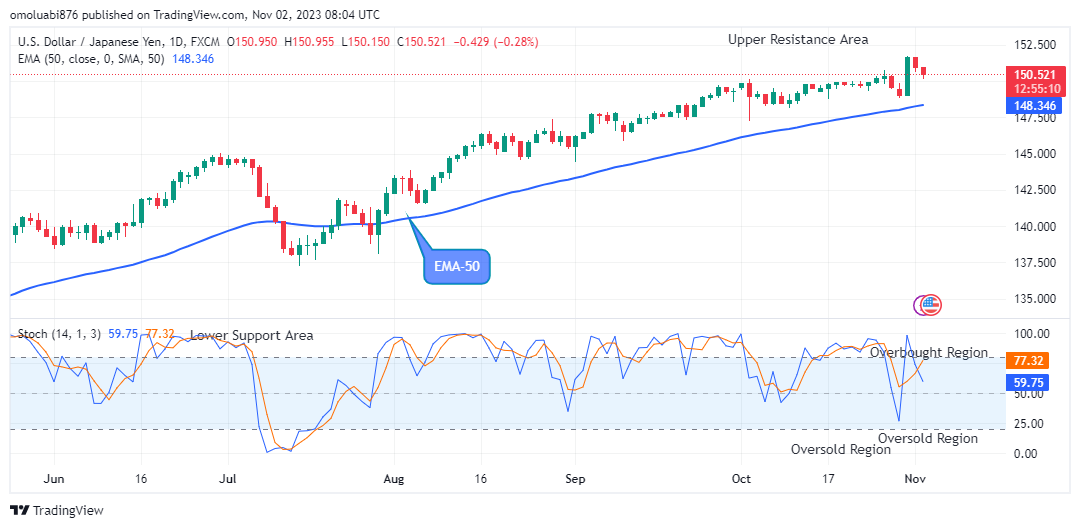
Analyzing the daily chart above, we can clearly see clearly that more downside is possible for the USDJPY pair to be trading in red above the moving average, this means that the momentum is in a bullish market zone in its long-term outlook. 
The bulls’ sustained pressure with a long bullish candle to a $151.72 resistance level on the 31st of October has made it possible for the Yen price to remain in an uptrend in its recent high.
The bulls lost momentum from here, as the bears started to step back in and pushed the market lower to the current trading level at a $150.34 low level above the EMA-50 as the daily chart opens today. This however signifies an uptrend.
Impulse move from sellers further dropped the market value of the Yen down to a $150.15 low level below the moving averages; this suggests a downward momentum in the price of USDJPY at the present and the return of sellers to stage a play is quietly noted.
However, continuation to the downside is certain as the stochastic indicator also shows the price of USDJPY pointing downwards, we therefore expect sellers to continue the bearish trend as the pair faces more downsides and this may get to the $137.92 soon which may further extend to the $135.00 lower support area in the coming days in its long-term perspective.
USDJPY Medium-term Trend: Bullish (4H Chart)
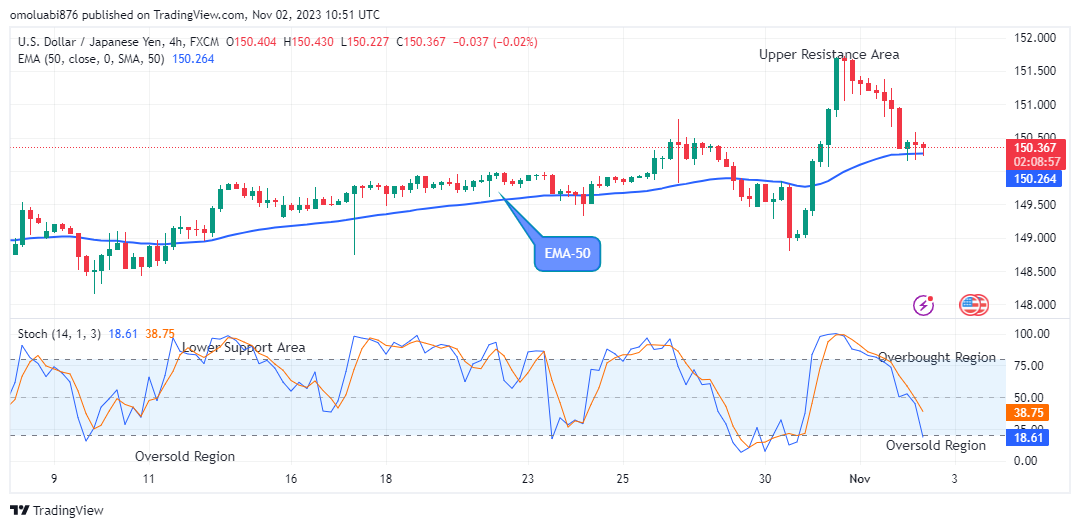
The USDJPY pair is likely to face more downsides as it continues in a downtrend market in its medium-term outlook. The price bars which are in red above the EMA line are now dropping as we can see from the chart below. 
The sustained bullish pressure at the $150.46 high level in the past few hours has made the Yen price stay above the supply level in its recent price level. However, the trend is about to change as the bears are seen dropping the prices down in a grand style.
The sell traders in-road briefly dropped the price of USDJPY down to the $150.22 support level shortly after the 4-hour chart opened today as the bears continued to dictate the market.
Hence, a break below the $148.42 previous support level will put the currency pair more on the selling side.
In like manner, the stochastic oscillator pointing down at around level 20% implies that the price of USDJPY is in a downward move and may likely face more downsides and continue in the same trend in the near days in its medium-term perspective.
Note: Forexschoolonline.com is not a financial advisor. Do your research before investing your funds in any financial asset or presented product or event. We are not responsible for your investing results.


Leave a Reply