The currency pair may decline to the $136.00 support level.
Sellers may take over the market soon.
USDJPY Weekly Price Analysis – February 16
At the moment the USDJPY market is trading in an uptrend. The pair may decline to the lower support level soon if the bears push harder and increase their selling motives in the market. The Yen price may likely drop below the resistance level and may perhaps retest the previous low at $137.92 level which may further decline to the $136.00 lower support level and beyond. Sellers can take their desired position from here, resulting in the best forex signal ever.
USDJPY Market
Key Levels:
Resistance levels: $148.00, $149.00, $150.00
Support levels: $140.00, $139.00, $138.00
USDJPY Long-term Trend: Bullish (Daily chart)
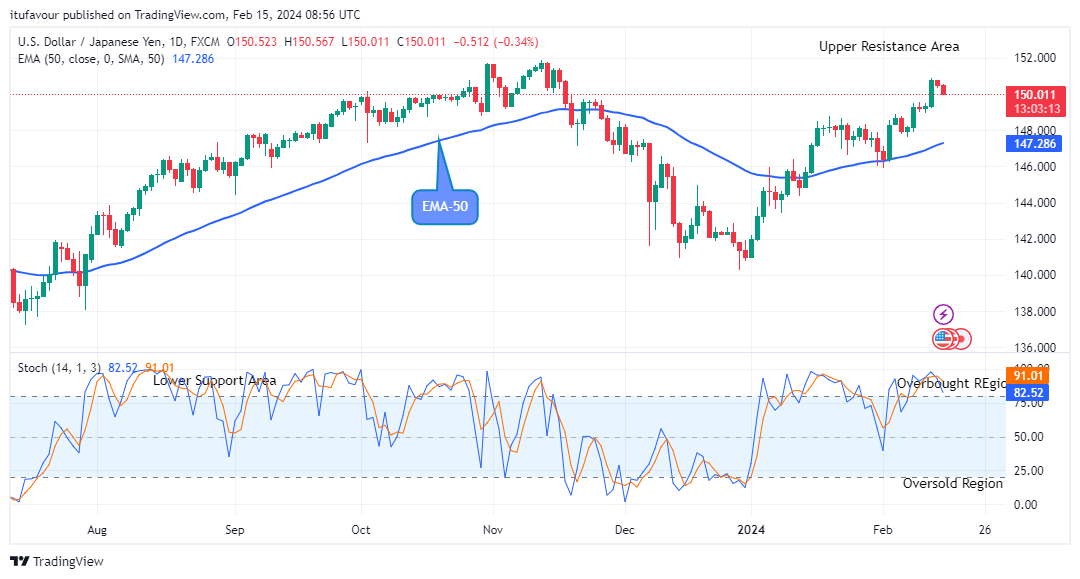
The USDJPY pair looks bullish but may decline to the support area soon as the new bearish moves have just begun on the daily chart. The price has started dropping above the supply level and this may decline to the lower support level.
The bears caused a drop in the market value of the USDJPY to $150.52 as the low of the day in the support area during yesterday’s session.
This however gives the bears more strength to continue the downward move as the daily chart opens today at $150.01 support level.
The market action of USDJPY is down at the $150.01 support level which is above the EMA-50 as at the time of writing this article. This suggests that the bulls are getting weaker as the sellers are set to dominate the market at the moment.
Thus, an increase in selling pressure and a sharp breakdown and closure below the $140.79 high value will invalidate any bullish thesis and may decline to a low at $136.00 value.
The stochastic oscillator signal pointing down at around level 83% in the overbought region suggests there may likely be a further decline in the trend in the days ahead and in this case, the USDJPY price may decline to a $136.00 lower support level in the coming days in the long-term perspective. Therefore, sellers may wait for this action to take place before taking their position.
USDJPY Medium-term Trend: Bullish (4H Chart)
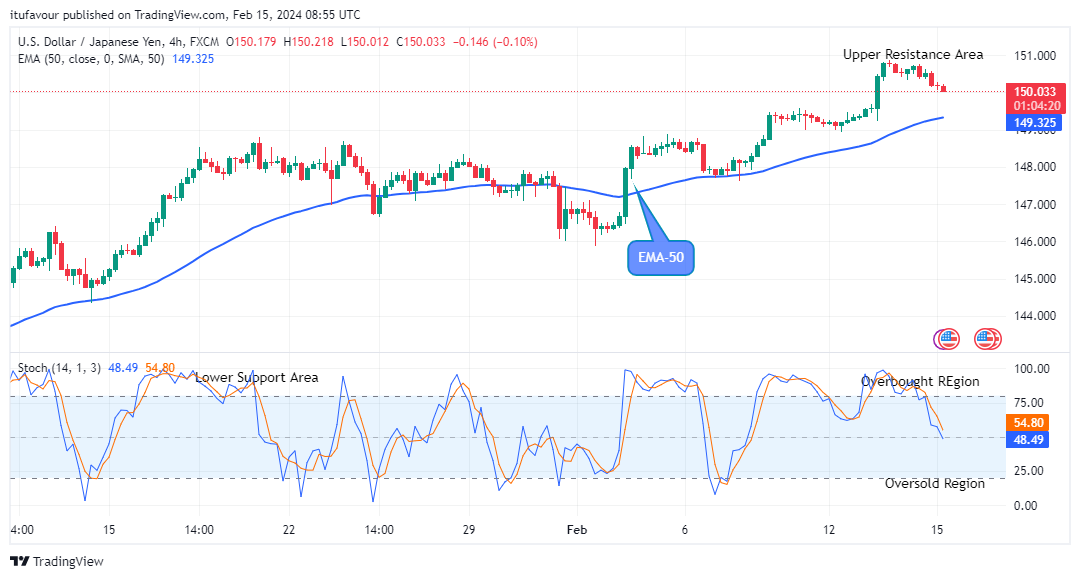
On the medium-term view, the USDJPY price also looks bullish but has started dropping and this may decline to the lower support level soon. 
The high bullish impact on the pair at the $150.62 high level in the previous action has contributed to its bullishness in its recent price level.
A drawdown is noticed on the chart at the moment as the USDJPY sellers made a drop in the Yen price to $150.01 above the EMA-50 as the 4-hour chart opens today. This is an indication that the bears are coming in gradually and the Yen price may decline or break down the $146.58 support level if the bears could intensify more efforts on their selling motives.
Notably, the signal of the stochastic oscillator signal pointing down at around level 53% suggests that the downward momentum may likely continue, in light of this, the USDJPY price may decline to a$136.00 lower support value in the nearby days in the medium-term.
Note: Forexschoolonline.com is not a financial advisor. Do your research before investing your funds in any financial asset or presented product or event. We are not responsible for your investing results.


Leave a Reply