USDJPY is slightly going in favor of the bears.
The currency pair could still increase despite a minor decline.
USDJPY Weekly Price Analysis – July 9
Should the bears increase their momentum, the support level at $104.233 may be retest.
USDJPY Market
Key Levels:
Resistance levels: $111.730, $111.735, $111.740
Support levels: $104.233, $104.238, $111.243
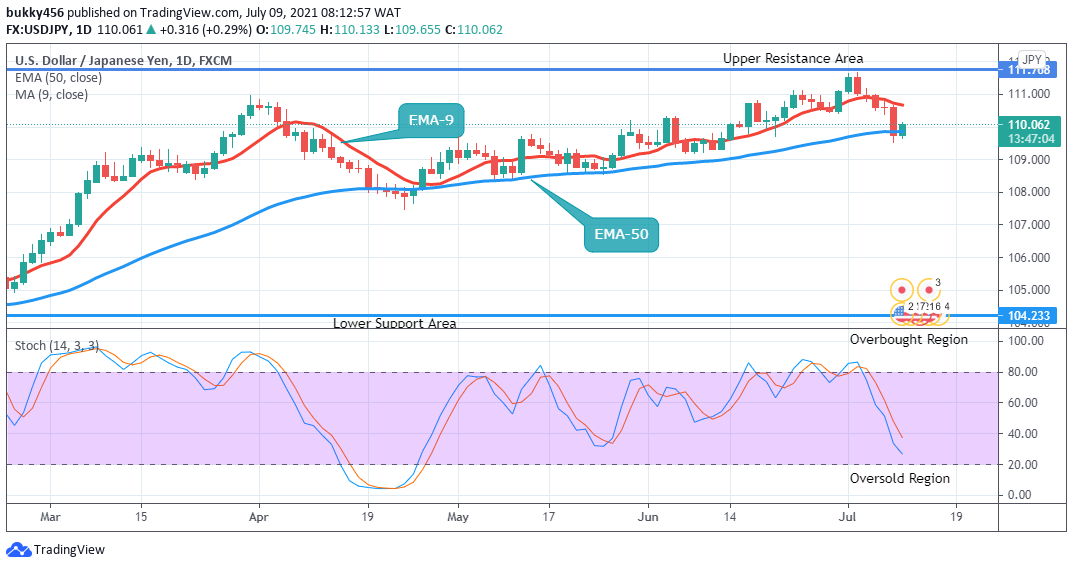
USDJPY Long-term Trend: Bullish USDJPY is in an uptrend in its long-term perspective. The impulsive move by the bear’s dropped the price of the pair down to $109.532 in the support area during yesterday’s session before the brief return of the bulls today.
The daily chart opens today at $109.745 in the resistance area.
The price of USDJPY is initially up at $110.333 in the resistance area above the EMA-50, an indication of a slight weakness in the strength of the bulls.
Hence, the stochastic oscillator signal pointing down at around level 27% in the oversold region indicates that the momentum in the price of USDJPY might likely experience a trend reversal in the days ahead. In this case a downtrend.
USDJPY Medium-term Trend: Bearish
USDJPY is now finding its way up as the bulls gradually staging a return to the market.
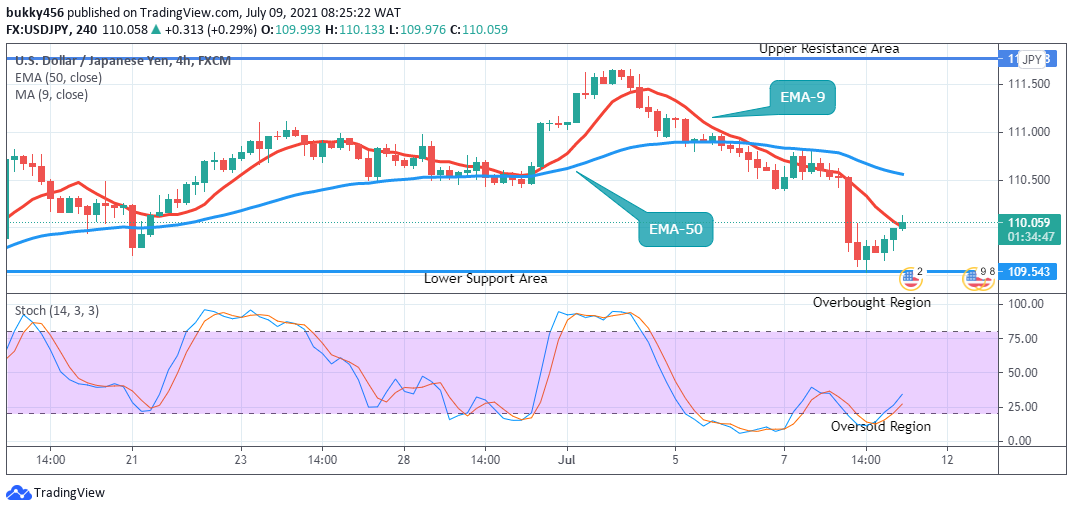
A bullish candle at $109.993 opens today’s 4-hourly chart in the resistance area as the bulls begin to stage returns into the market.
The price of USDJPY is up at $110.133 in the resistance area below the two EMAs, this suggests a downward trend in the momentum of the currency pair.
However, the stochastic signal pointing up at around level 34% in the oversold region suggests that the currency pair may encounter a change in trend sooner or in the days ahead in the medium-term and In this case an uptrend.
Note: Forexschoolonline.com is not a financial advisor. Do your research before investing your funds in any financial asset or presented product or event. We are not responsible for your investing results.


Leave a Reply