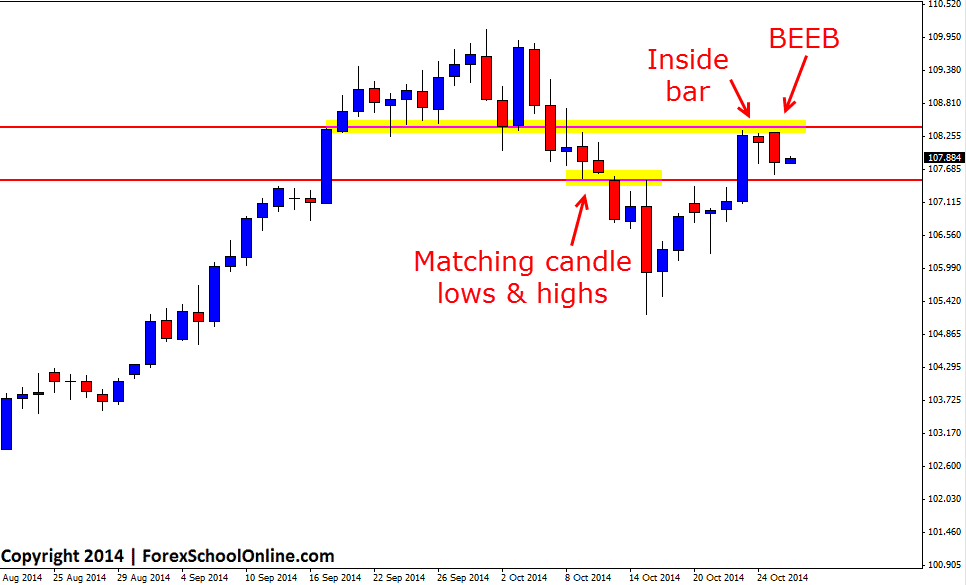
The USDJPY has formed a Bearish Engulfing Bar (BEEB) on the daily price action chart. This bearish engulfing bar has been printed on the daily chart after price stalled and formed an Inside Bar (IB) which is highlighted on the chart below. Although this is an engulfing bar, it is still inside the previous housing candle which shows that when this engulfing bar was formed price tried to test the highs of the resistance, but as yet has not been able to break through.
Before moving into this consolidation that price is in now, price was trading higher in an up-trend. Price had made a deep retrace back lower, but then it was looking to continue with the trend back higher. Price is now caught in a pause under the daily resistance level with the bearish engulfing bar formed.
The bearish engulfing bar is a small and unconvincing one and just below the low of the engulfing bar as the chart shows below; there are a couple of matching candle highs and lows that could act as a support/trouble area for price trying to move lower. If price can break this trouble area, then the next support looks to come in around the 106.80 level.
The solid play could be to see if price can breakout of the resistance overhead and then start looking for breakout and re-test trades on the intraday charts such as the 4 hour, 1 hour or potentially even smaller charts for high probability price action setups such as the ones taught in the Forex School Online Price Action Courses to get long. In other words; look for price to breakout higher and through the resistance and then look for price to make a quick re-test back into the same key daily resistance to see if it holds as a new price flip support level on a smaller intraday chart as I go through in the trading lesson here;
First Test Support/Resistance Price Action Trading Strategy
USDJPY Daily Chart


Great article Jonathan. I decided to take a long position with a tight SL on USDJPY before the FED comments because from a tech perspective most bullish set ups so close to the 50 SMA ( I only use mave’s as reference) on the daily chart even though price is correcting and has recently printed a bearish engulfing bar they have a higher probability of succeeding. When looking at the aggregate and putting in context in order to analyze structure PA set ups tends to be more effective with the overall trend. Thank you for you hard work. I find your PA course extremely helpful.