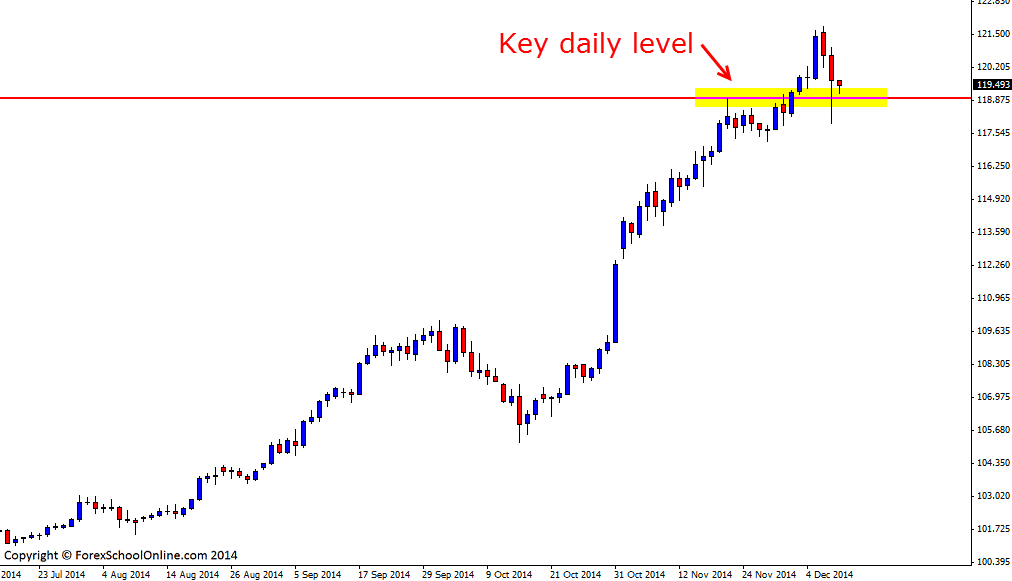
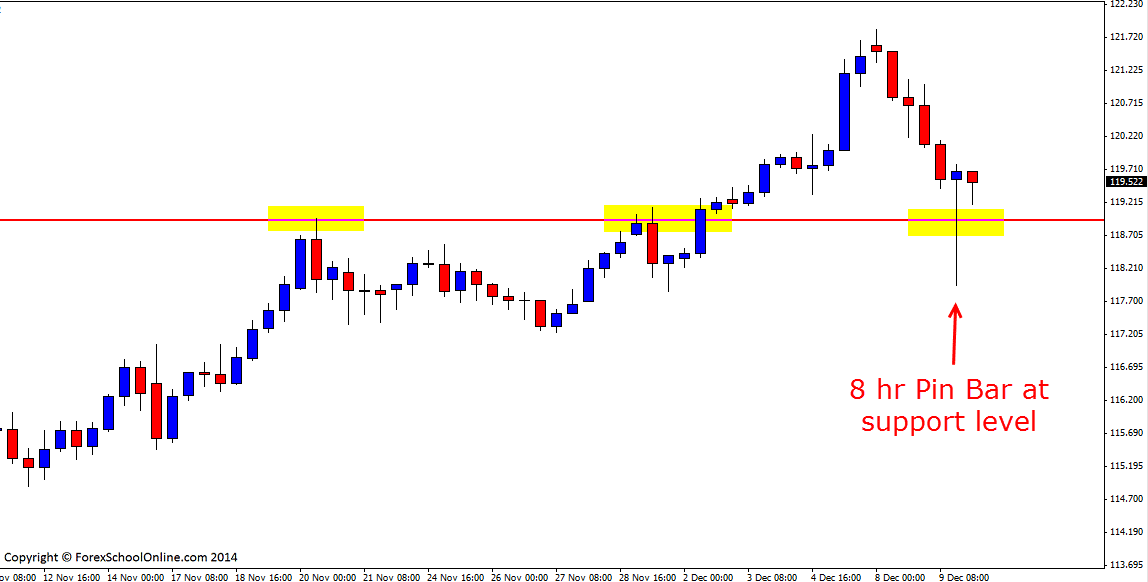
The USDJPY has fired off a pin bar reversal on the 8 hour price action chart. This pin bar reversal is sticking out and away and is down at a swing low within the strong recent trend higher. Price as the daily chart shows below; has been in a super strong trend of late higher with price making a huge move in the last six months. This move higher started around the start of July this year and has culminated in price moving from around a low of 101.40 to highs of 121.84 which just goes to show just how strong, aggressive and fast this daily trend has been on this pair of late.
Within this trend, price rotated back lower and into a daily support level. At the daily support price has fired off the 8 hour pin bar reversal. For price to have any chance of breaking and continuing the trend higher, price would need to confirm the pin bar reversal and break the pin bars high. I discuss why this is so important and how to enter price action trigger signals in the trading tutorial here;
Using Confirmation With Your Price Action Trigger Signals
If price can break higher and gain momentum it may signal the trend continuing. There is a minor resistance sitting overhead around the 120.20 area that could act as a minor trouble area. If price cannot break higher and instead rolls lower, the first level to watch will be the support that the pin bar is rejecting because if this support level gives way, it will be crucial for where price moves in the coming sessions. If price does move lower and through the support level traders would then need to watch the market to see how the price action behaves and for other price action indications, for example; does the support become a new price flip resistance or is there a new 1,2,3 trend change pattern in forming.
Note: To make a different time frame chart with your MT4 platform such as the 8 hour chart I have below or to make any time frame you want with your MT4, please read the trading lesson;
Change MT4 Time Frame Indicator EA
USDJPY Daily Chart

USDJPY 8 Hour Chart


Leave a Reply