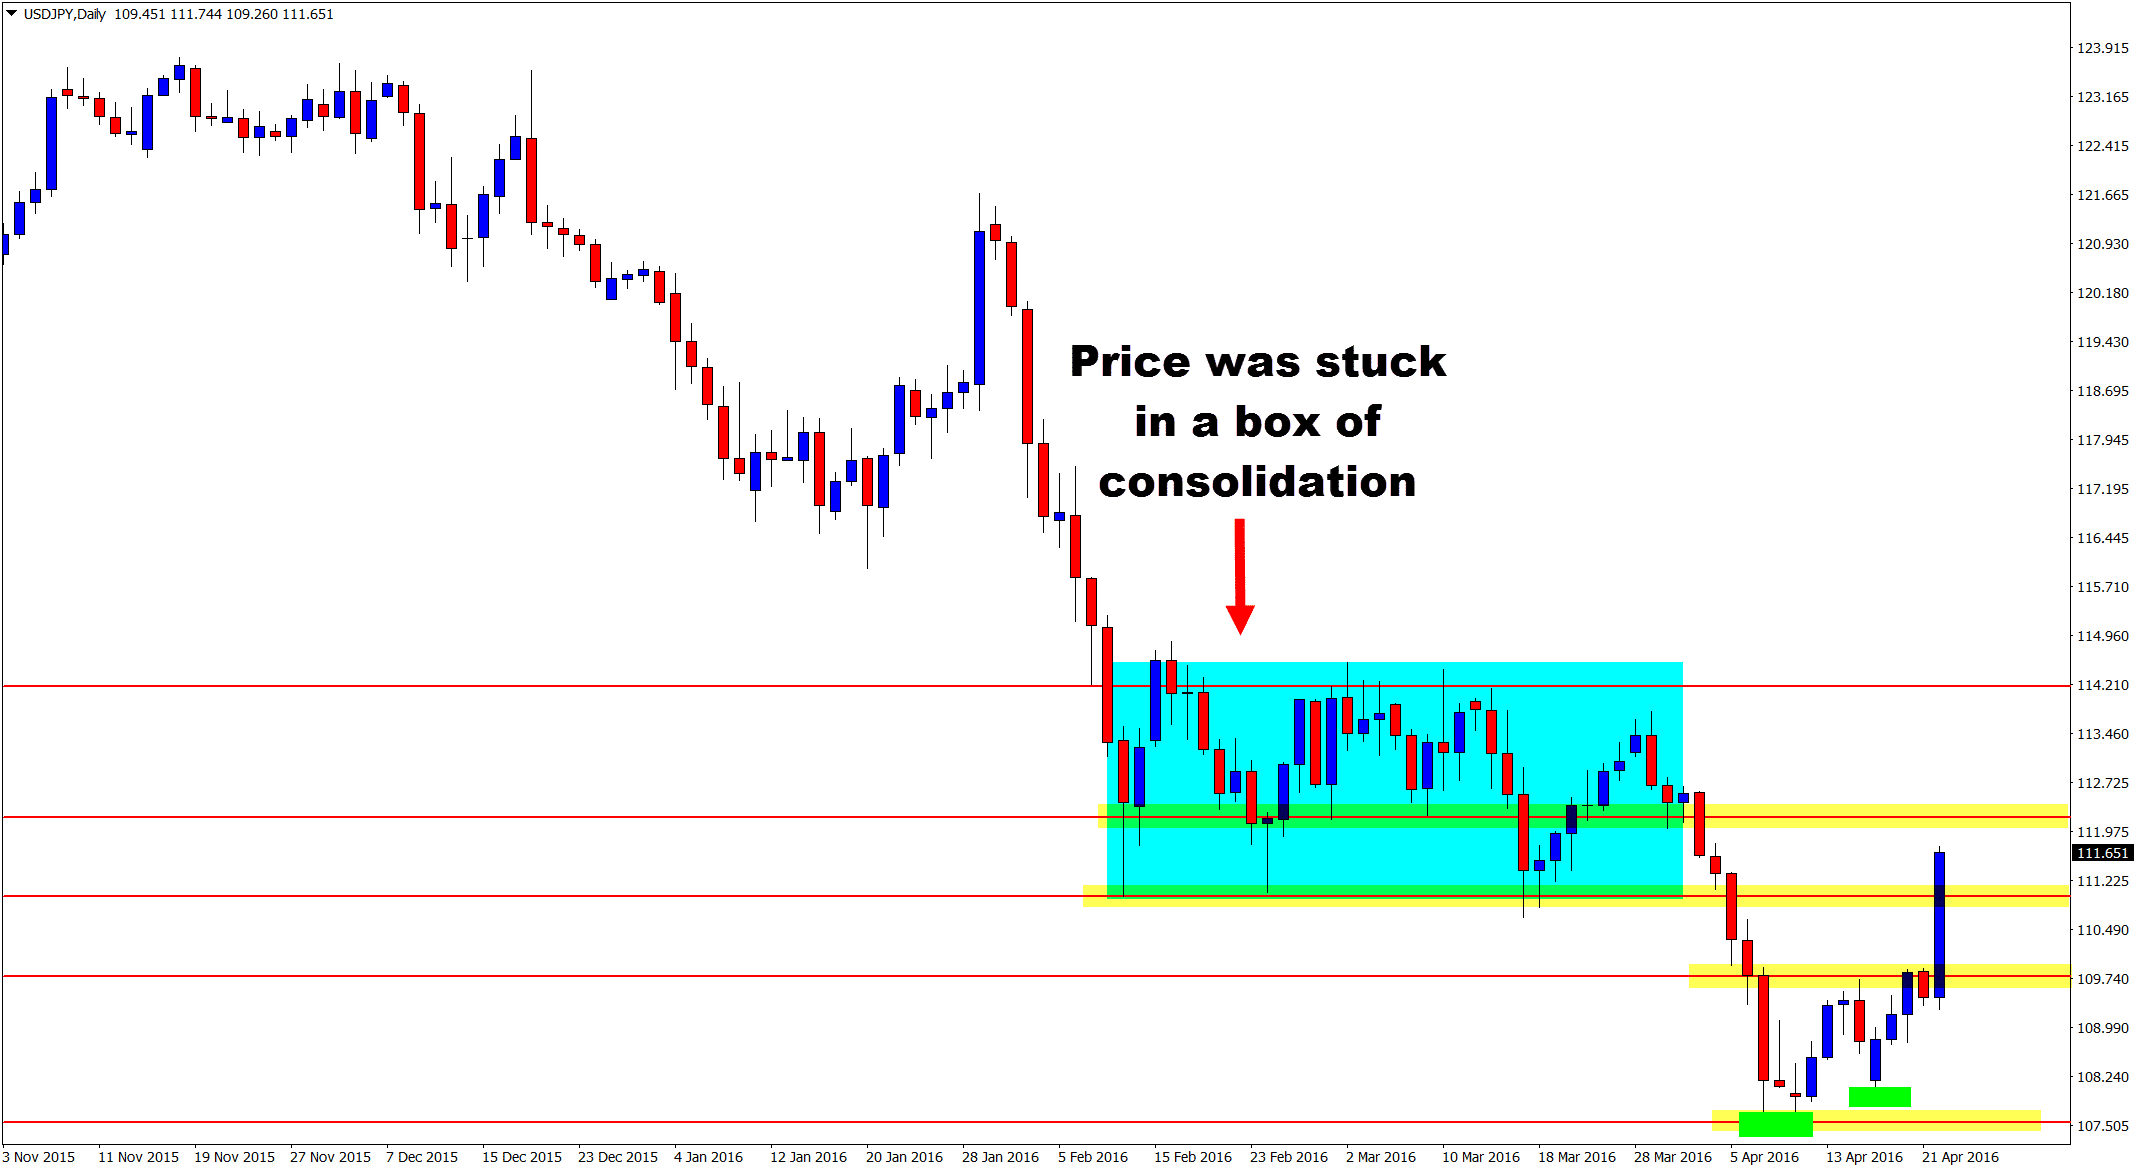
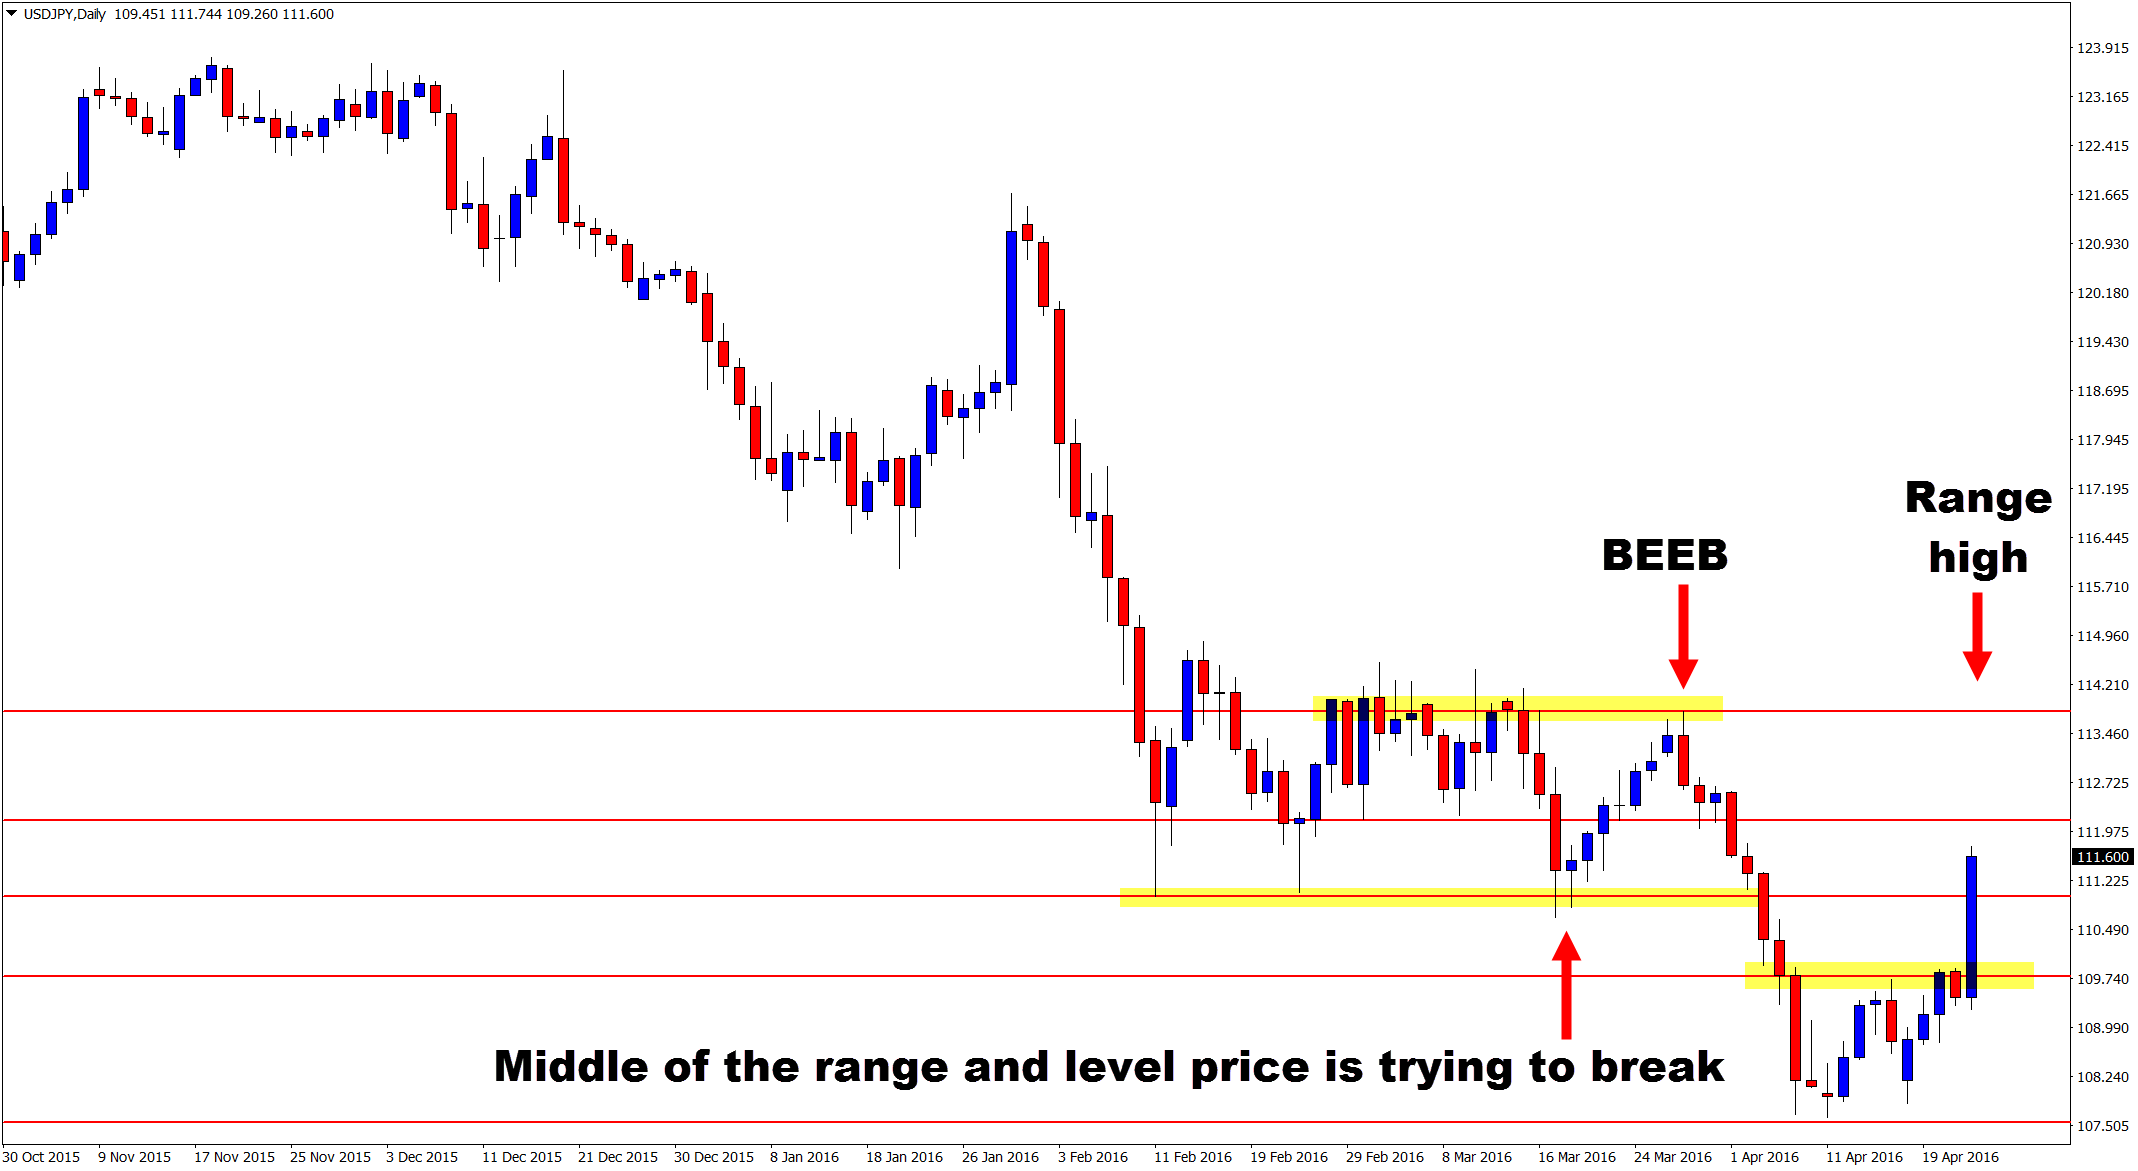
Price on the daily chart of the USDJPY is a flutter with trigger signals and other large patterns just at the moment all of a sudden after a large absence. As the two daily charts show below; price is now trying to break higher, out of the mid-way point of the daily ranging area to move into the near term highs.
This move and strong bust higher has occurred after price made a very strong attempt to break and continue the trend lower. I have discussed and gone through in this section of the blog a few times in the past just how price action normally takes a few attempts before making a reversal. It rarely just reverses and it is even rarer to happen in just one candle.
Notice in this market how price first tried to continue moving lower, it found the first support and bounced higher, it then formed the Bearish Engulfing Bar = BEEB and made ANOTHER attempt to continue the trend lower. Also take note on your daily chart how on this reversal back higher with price making the move against the trend to the upside, the second swing low had a higher low. Price did not make it all the way back into the support and this is so often the case and a crucial clue to watch for.
I have put the green boxes on the swing points below on my chart to highlight the areas I am talking about so you know exactly what I mean.
For those of you that read this “Charts in Focus” section regularly you will know that the price action story and the market type are king and how you play a trade depends on the market type. If a trade is in a strong trend, then we are looking to trade with the trend.
With this market, price is in a chop and very sideways. We can look to trade both long and short. If price now pulls back into the old resistance and new support area we could watch that level to see if price forms any bullish trade setups on the intraday time frames such as the 4 hour and 1 hour charts.
If price now moves higher we could watch the resistance area to see how the price action behaves making sure that any potential trade setups are confirmed with High Probability A+ trigger signals like the ones taught in the Members Only Price Action Course.
USDJPY Daily Chart – Boxing & Consolidation

USDJPY Daily Chart – Price Action Trigger Signals

Related Forex Trading Education


Leave a Reply