USDJPY is facing more pressure from the bulls.
The currency pair is in a strong bullish trend both in the long-term and medium-term outlooks.
USDJPY Weekly Price Analysis – July 2
USDJPY found resistance again around the $111.658 level, signaled a new upside momentum.
USDJPY Market
Key Levels:
Resistance levels: $111.658, $111.670, $111.682
Support levels: $104.233, $104.223, $104.213
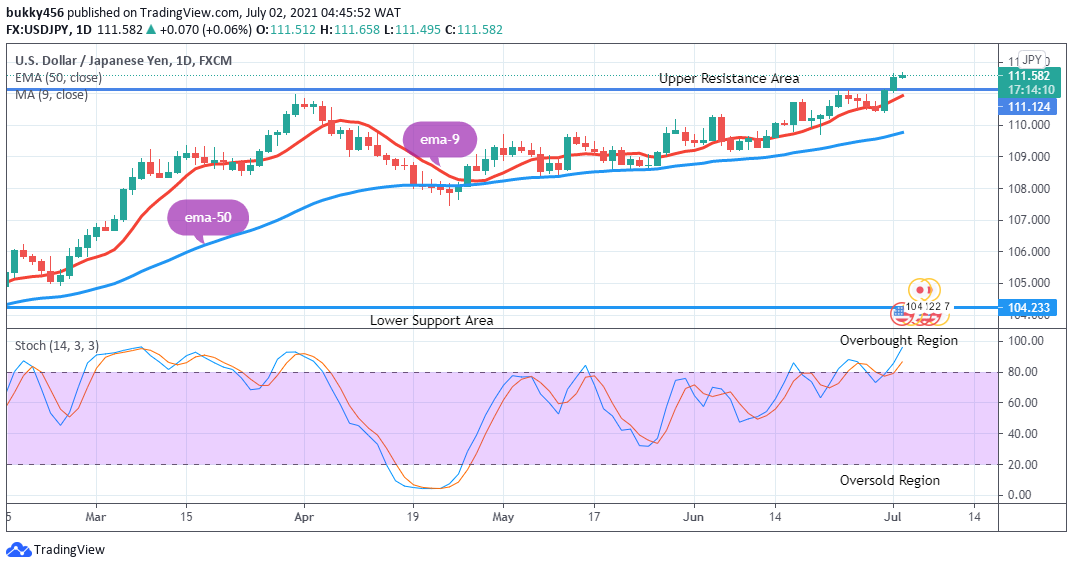
USDJPY Long-term Trend: Bullish The currency pair is bullish on the daily chart. The bull’s increase momentum pushes the price of the USDJPY and broke up the resistance line at $111.639 in the resistance area during yesterday’s session and sustains it.
Today’s daily chart at $111.512 opens with a bullish inverted pin bar candle above the resistance line in the upper resistance area. A signal of a trend reversal. The bulls’ pressure on the currency pair pushes the price further up at $111.658 in the resistance area as the journey up north continues.
Price is initially up at $111.658 in the upper resistance area above the two EMAs’ which are fanned apart, this suggests an uptrend in the context of the market. The bulls are in control at the moment.
The stochastic signal pointing up at around level 86% in the overbought region implies that the momentum in the price of the Yen is in an uptrend in the long term. Hence a buy signal.
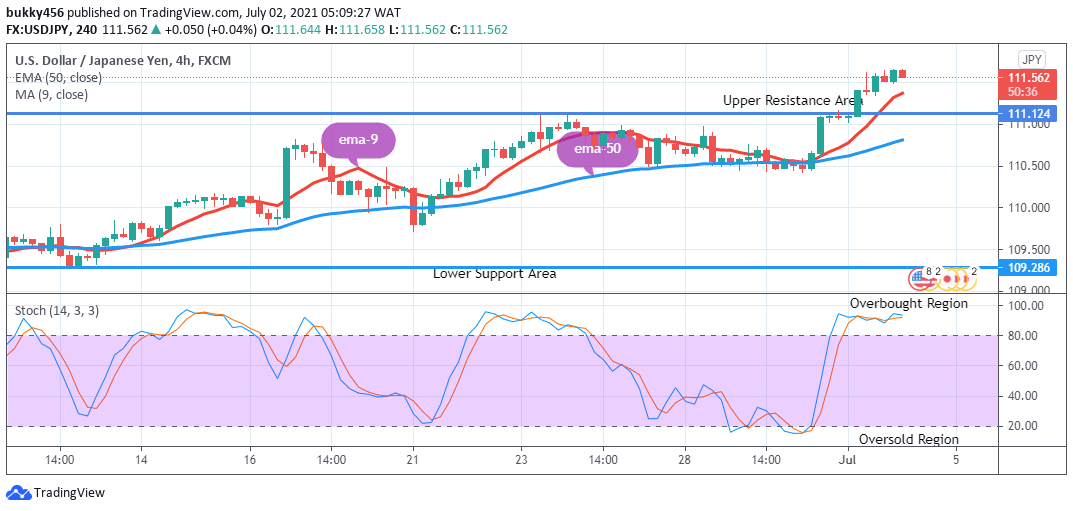
USDJPY Medium-term Trend: Bullish USDJPY continues in a bullish trend in its medium-term outlook. The sustained bullish pressure pushed the currency pair further up at $111.652 in the upper resistance area during yesterday’s session.. The bears return gradually with an initial drop to $111.512 in the support area before the end of yesterday’s session.
Today’s 4-hourly chart opens on a bearish note at $111.644 in the support area as the seller returns briefly in the early hours of the session.
The Yen is initially down at $111.563 in the support area. With the price above the two EMAs trading in the upper resistance area indicates the price of USDJPY is in an upward move and being dominate by the bulls.
However, the stochastic oscillator signal is pointing down at around level 80% in the overbought region is an indication of a trend reversal in the days ahead.
Note: Forexschoolonline.com is not a financial advisor. Do your research before investing your funds in any financial asset or presented product or event. We are not responsible for your investing results.
Learn to Trade Forex Online
USDJPY Bounces Up At $111.658 Level, Targeting $111.700
Footer

ForexSchoolOnline.com helps individual traders learn how to trade the Forex market
WARNING: The content on this site should not be considered investment advice and we are not authorised to provide investment advice. Nothing on this website is an endorsement or recommendation of a particular trading strategy or investment decision. The information on this website is general in nature so you must consider the information in light of your objectives, financial situation and needs.
Investing is speculative. When investing your capital is at risk. This site is not intended for use in jurisdictions in which the trading or investments described are prohibited and should only be used by such persons and in such ways as are legally permitted. Your investment may not qualify for investor protection in your country or state of residence, so please conduct your own due diligence or obtain advice where necessary. This website is free for you to use but we may receive a commission from the companies we feature on this site.
We Introduce people to the world of currency trading. and provide educational content to help them learn how to become profitable traders. we're also a community of traders that support each other on our daily trading journey
Forexschoolonline.com is not a financial advisor. Do your research before investing your funds in any financial asset or presented product or event. We are not responsible for your investing results.

Leave a Reply