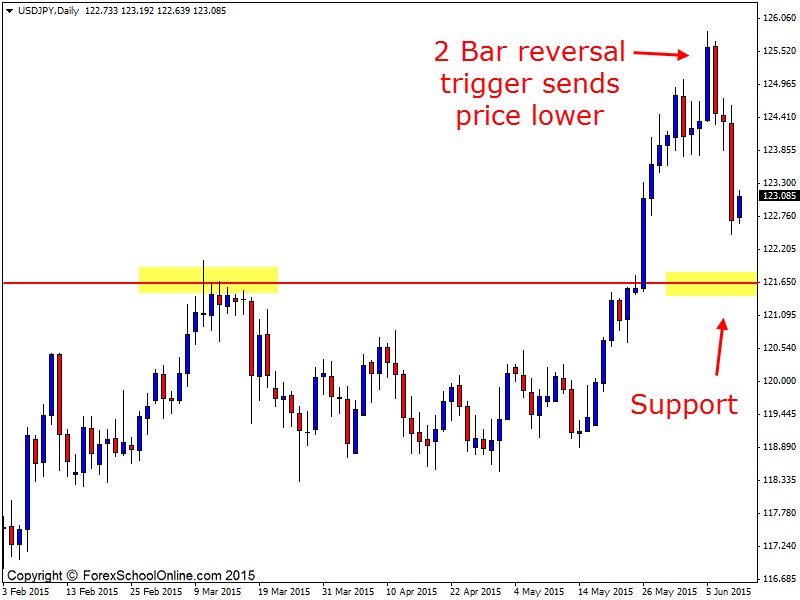
Price has started to retrace back lower and into a major daily support level after price action fired off a 2 Bar Reversal trigger signal at a swing high. After breaking the low of the 2 bar reversal, price has collapsed and run lower breaking into all the space that was there for price to move into.
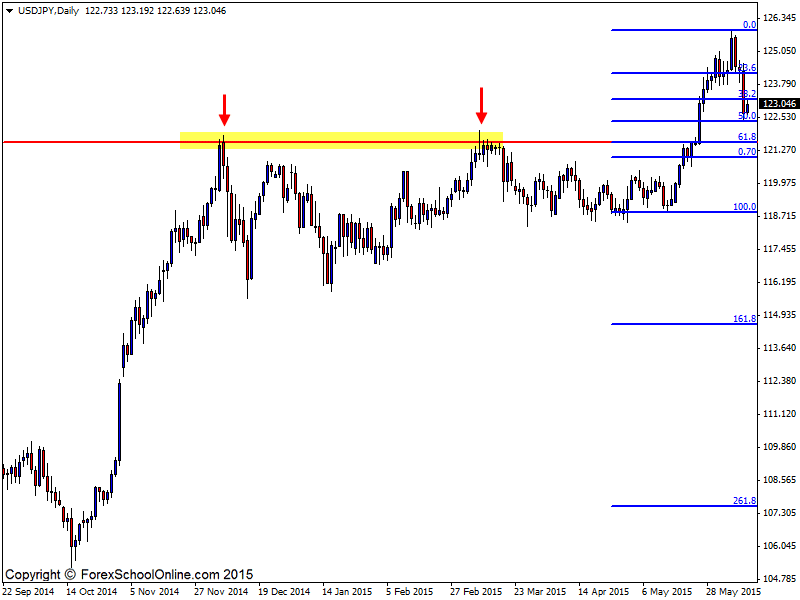
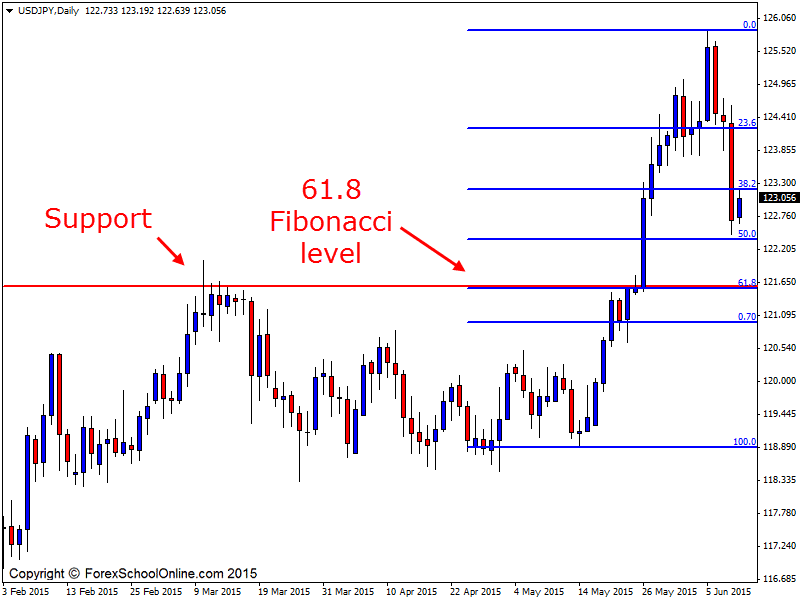
If price can continue to move lower the next major support that it will run into is around the 121.65 area which is also the 61.8 Fibonacci level as shown on the 2 charts below with one zoomed out and the other zoomed in.
Whilst we don’t regularly use Fibo levels here at Forex School Online we do use the obvious levels. I must stress that the Fibonacci tool needs to be used correctly and it needs to be used as a confirmation tool only. As price action traders the price action is always KING.
Trades are never based solely of what the Fibo is doing or what it is telling us. What we can do however, is use the Fibo to give us added confluence or another factor in our trades favor and something else to help us build the overall price action story.
With the daily chart we can see that price had been in a strong trend higher before it paused and then broke higher again. Price is now back to test the old breakout area. It is this old breakout area that is the major daily support and also the 61.8 Fibo level.
This could be a really solid level to hunt long setups both on the daily and also shorter term time frames if bullish price action can present and fire off. I highly recommend you read my trading lesson on how to trend trade with price action here;
How You Can Trend Trade Price Action
Daily Chart

Daily Chart – Fibonacci Zoomed Out

Daily Chart – Fibonacci Zoomed In


Thanks! I saw that support area too, but never thought of using the Fibo as additional confluence.
In the event that the Fibo doesn’t provide confluence, in order to ascertain that the Support area is a good place to hunt trades, do we have to see whether the support area has been respected significantly in the past?
So in what scenario do we bring in Fibo?
Thanks. Really enjoy reading your blog.
Hi Gary,
this is not a cut and dry answer and I will try and give you as much explanation as to why; When looking at a trade setup you are not just looking at a support or resistance level. The same for you are not just looking at a trigger signal.
You are looking at the whole price action story and what goes into the whole chart and what goes into making a high probability setup and that is what makes each level or supply and demand point.
For example; I am going to need to trade from a completely different level and have different things to trade against the trade, compared to if I am trade with the trend.
If I am trading with the a strong trend I may trade from a level that price has only just made a swing point back to i,e a recent last high or low, but if I am trading a range or counter trend I need to see a major level.
Hope this helps,
Johnathon