Market Analysis – USDCHF Employs a Bullish Flag Pattern to Continue the Upward Momentum
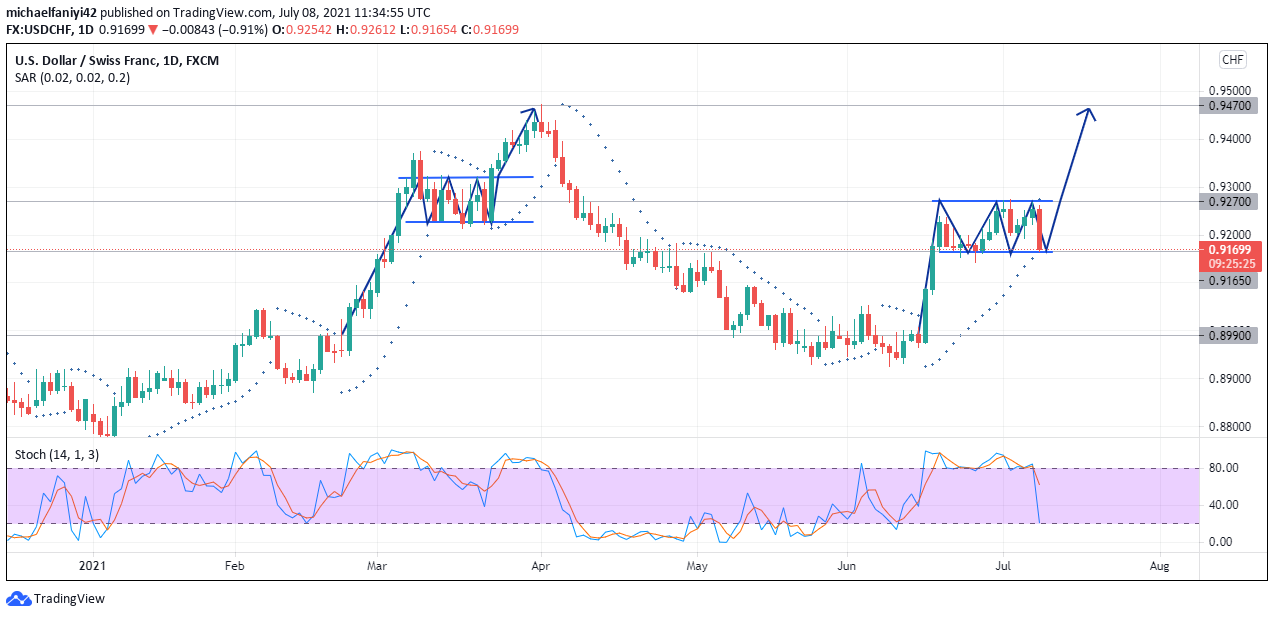
USDCHF to continue upward momentum after employing the bullish flag formation. This is a repetition of a pattern that was carried out earlier in the year on the 22nd of February 2021.
During this time, the market sprang from the 0.8990 support level and landed above the 0.92700 resistance level. This formed the flag pole for the formation. Then the price dropped to the flag support level and moved up again to the flag resistance level. This continued in a mini consolidation phase for ten trading days before the bulls broke out of the flag to continue its upward momentum. The market continued upwards till it touched the weekly resistance at 0.94700, where it began a swift descent. From there, the market continued downward till it found succor around the 0.89900 key level. At this point, the market decided to conform to the initial flag pattern to continue its upward momentum. A surge in the price happened from the 16th to the 18th of June 2021 for the flag pole, seen with consecutive bullish candles. The market then rested on the 0.91650 key level and is now ranging with the 0.92700 resistance for the flag.
The market opened today with a strong bearish candle to fall to the flag support. The Parabolic SAR (Stop and Reverse) indicates that upward momentum is still predominant with USDCHF. The Stochastic oscillator has its blue signal line having fallen to the edge of the oversold region while the red line has just dropped a little from the overbought region.
USDCHF Key Levels
Resistance Levels: 0.94700, 0.92700
Support Levels: 0.91650, 0.89900
 Market Expectations
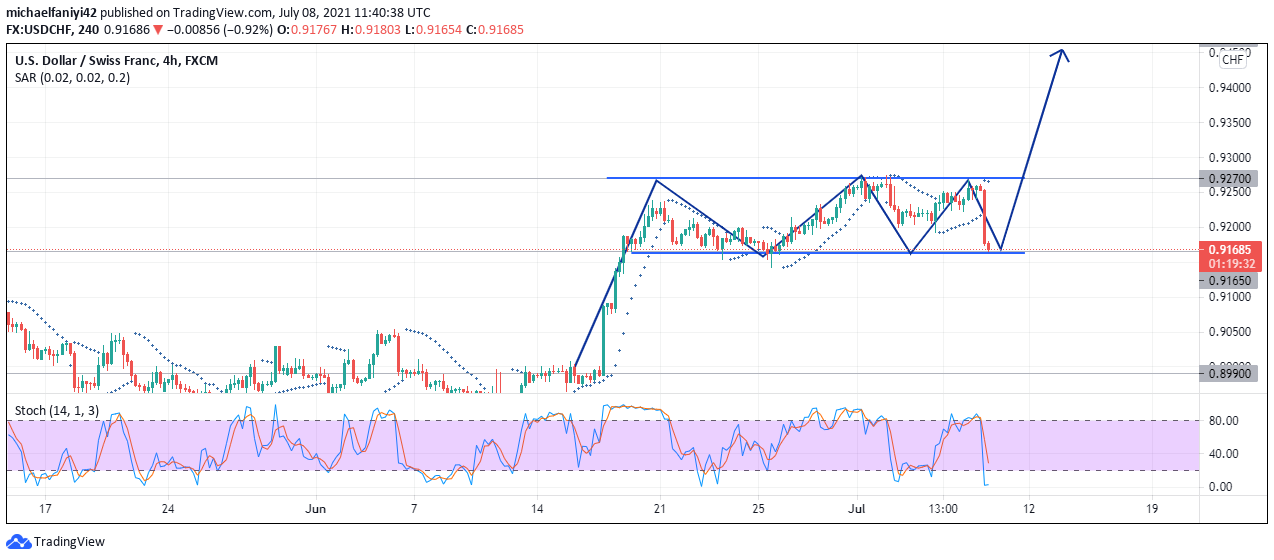
On the 4-hour chart, two consecutive bullish candles have crashed into the lower border of the flag. The Parabolic SAR displays two dots above the candles to this effect. However, the Stochastic oscillator has its blue signal line deep into the oversold region while the red line is close to the oversold border.
USDCHF is expected to bounce off the lower border of the flag pattern and break out upwards to 0.94700.
Note: Forexschoolonline.com is not a financial advisor. Do your research before investing your funds in any financial asset or presented product or event. We are not responsible for your investing results.


Leave a Reply