USDCHF Key Zones
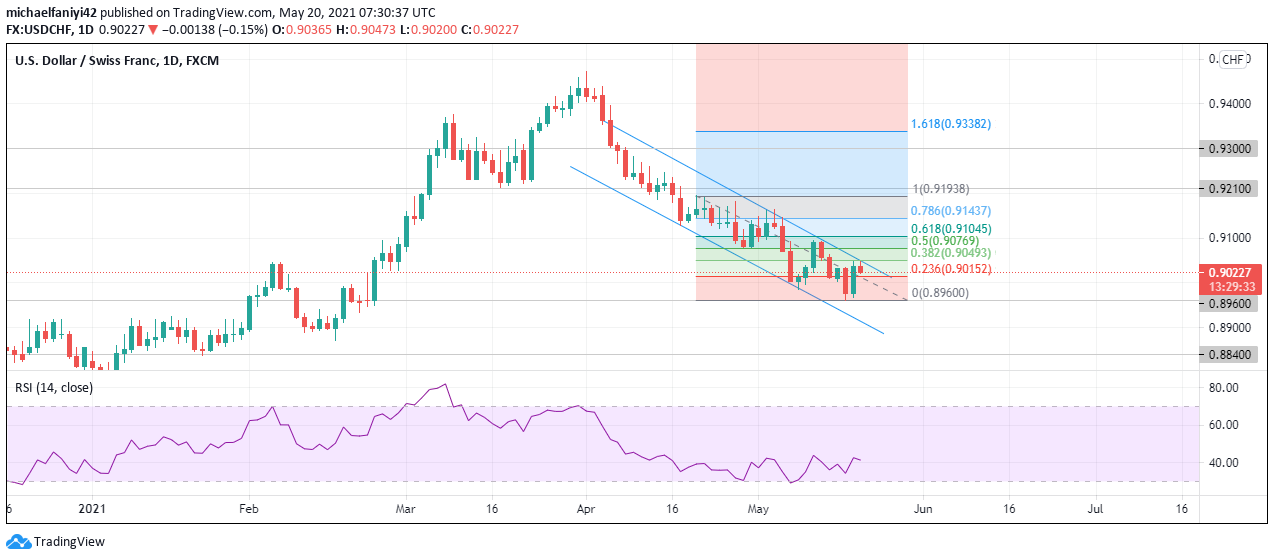
Resistance Zones: 0.9210, 0.9300
Support Zones: 0.8840, 0.8960
USDCHF has been on a bearish momentum since the first day of April 2021. This is an abrupt change in direction of the market which had been experiencing a steady rise in price since the 16th of February 2021. There was a temporary consolidation phase on the 9th of March which lasted till the 24th of March, after which USDCHF rose to 0.94700 resistance on the 1st of April 2021, since then the Swiss Franc has rapidly been gaining strength at the expense of the U.S. Dollar.
 USDCHF Price Anticipation
The market is on a general downward trend, but the price has been showing retracement consistently along with the trend. This can be seen with successive lower highs and lower lows. As at the time of writing, the price has opened with a small bearish candlestick which shows selling momentum. The candlestick just appears below the upper border of the descending trend line. This position appears to coincide with the 0.382 Fibonacci level. As a result, USDCHF is facing a major resistance going forward and is set to be pressed down in continuation of bearish momentum to the next support at 0.89600
The RSI (Relative Strength Index) has its signal lines at 42.00 and looking downward, which is a selling bias.
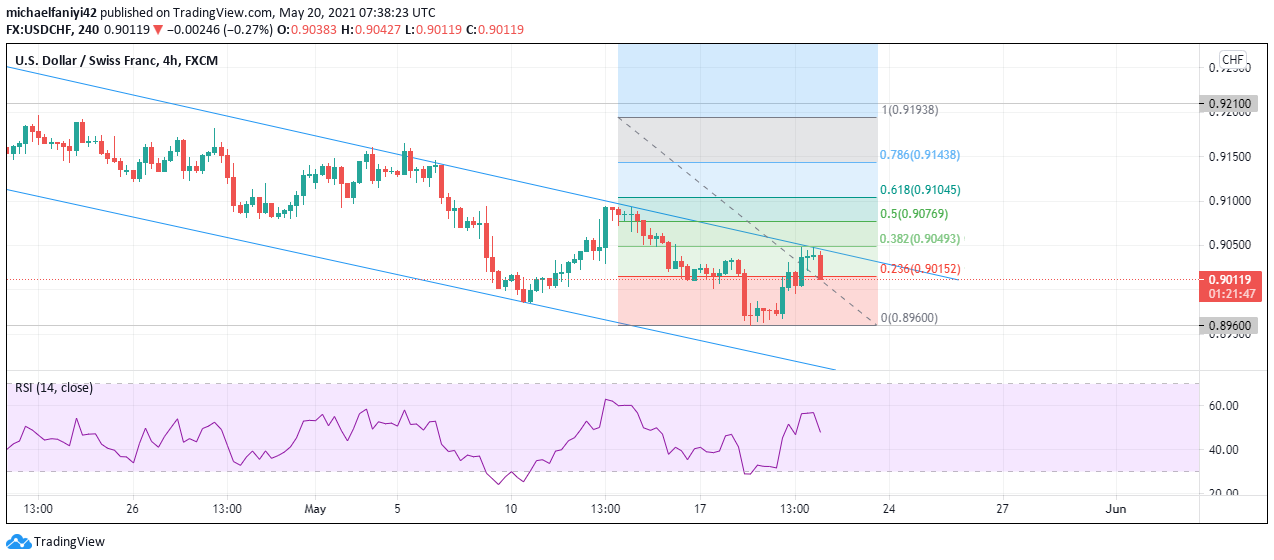
On the 4-hour chart, the market is already on a descent. The day has opened with a Doji candlestick which shows indecision, and then a bigger bearish candlestick to show sellers in control. The candlesticks appear just below the confluence of the upper border of the downward trend line and the 0.382 Fibonacci level.
The RSI, though at 47.37, shows an active selling as the signal line is plunging downwards. USDCHF is expected to continue in its bearish momentum.
Note: Forexschoolonline.com is not a financial advisor. Do your research before investing your funds in any financial asset or presented product or event. We are not responsible for your investing results.


Leave a Reply