USDCHF Key Zones
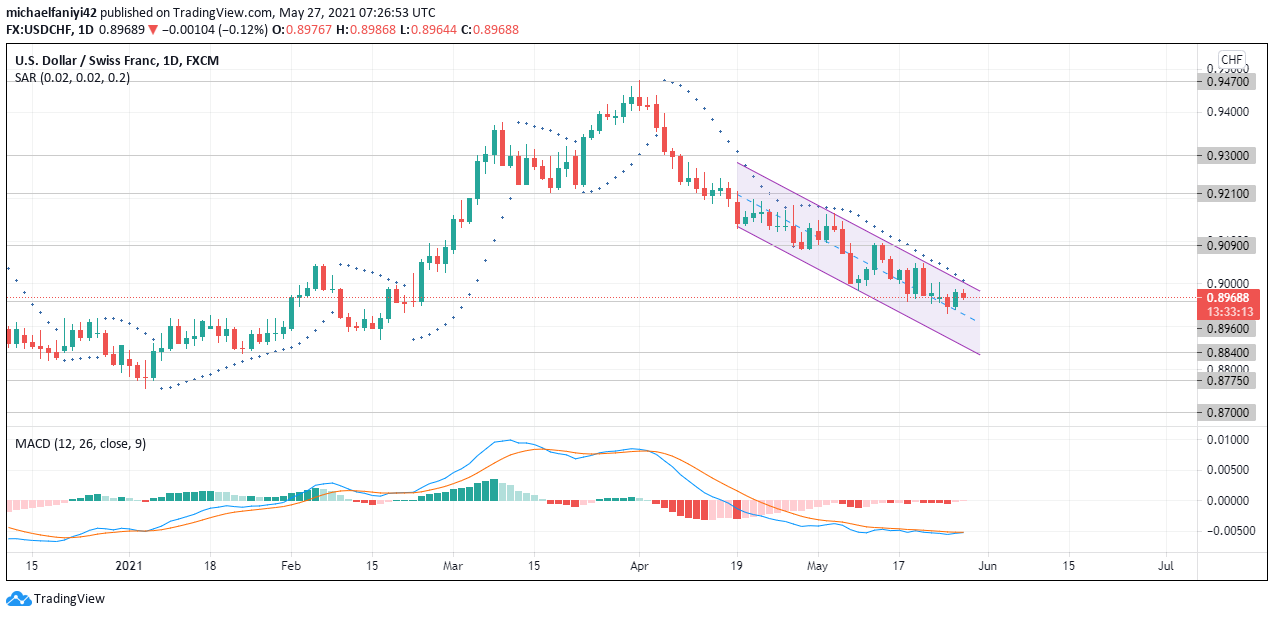
Resistance Zones: 0.9090, 0.9210, 0.9300, 0.9470
Support Zones: 0.8700, 0.8775, 0.8840, 0.8960
USDCHF Market Analysis
USDCHF has been on a downward spiral since the 1st of April 2021. The key levels have been very effective in coordinating the market. This can be seen in how they influence price movement. On the 10th March 2021, 0.930 and 0.921 key levels trapped the market to a range, after which price broke upwards. USDCHF then met a very strong weekly resistance on 1st April 2021 at 0.9470, which repelled the price downwards. There was also some sideways movement between 0.9210 and 0.9090 before the price broke beyond the support. At the next support of 0.8960, there is also sideways movement. Price again seeks to break down past the support.
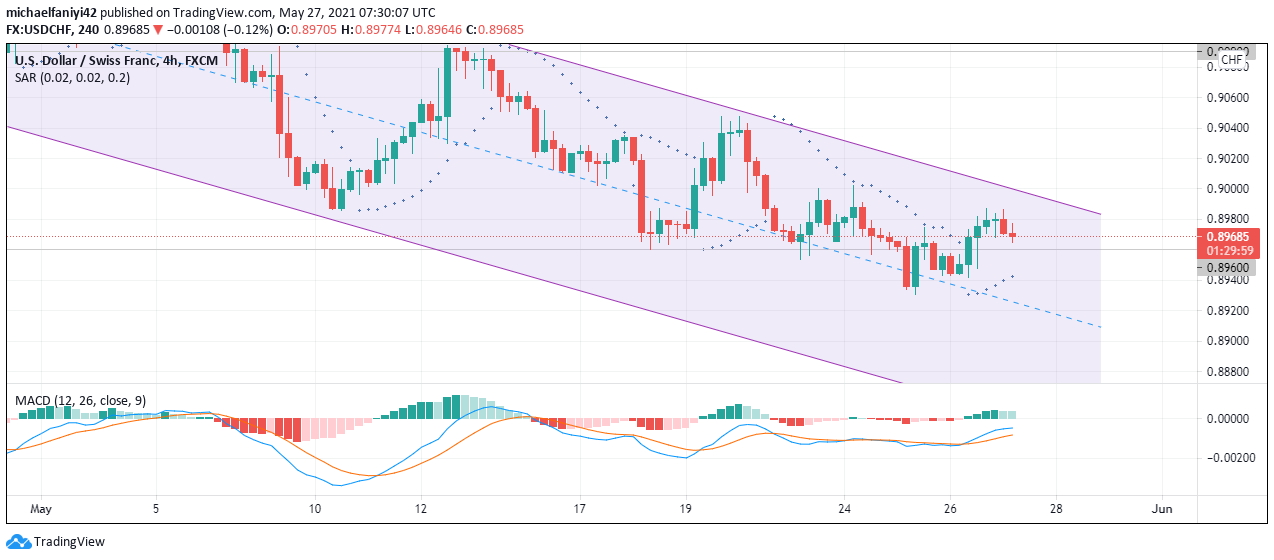
The action of the key levels has ensured that the market’s movement is in a zigzag manner in a descending parallel channel. The parallel channel middle line also acts as support/resistance. The middle line has pushed the market to the 0.8960 support which is close to the upper border of the descending channel. It is expected that the price will eventually plunge below this support. But if 0.8960 becomes too strong, it could lead to a bullish action of an upwards breakout from the parallel channel.

What to Expect From USDCHF
After the plunge of the market on the 1st of April, the Parabolic SAR (Stop and Reverse) has shown very strong sellers’ activities by displaying the dots over the candles. This and that the market is set to maintain its downward trajectory. The MACD (Moving Average Convergence Divergence) is below the zero level at -0.00516. The decreasing red histogram bars is due to the support currently preventing the price from going lower.  On the four-hour chart, the 0.8960 support in conjunction with the parallel channel middle line has combined to keep the price from going low, but as the candlesticks approach the upper border of the descending channel, USDCHF is expected to gain strength and go bearish. The Parabolic SAR is currently beneath the candle. This points to a current bullish action within the descending channel. The MACD on this time frame is also below the zero level. Its green histogram bars are a result of the retracement due to the 0.8960 support.
Note: Forexschoolonline.com is not a financial advisor. Do your research before investing your funds in any financial asset or presented product or event. We are not responsible for your investing results.


Leave a Reply