USDCHF Analysis – The Price Retests the Double Bottom Neckline Before a Breakout
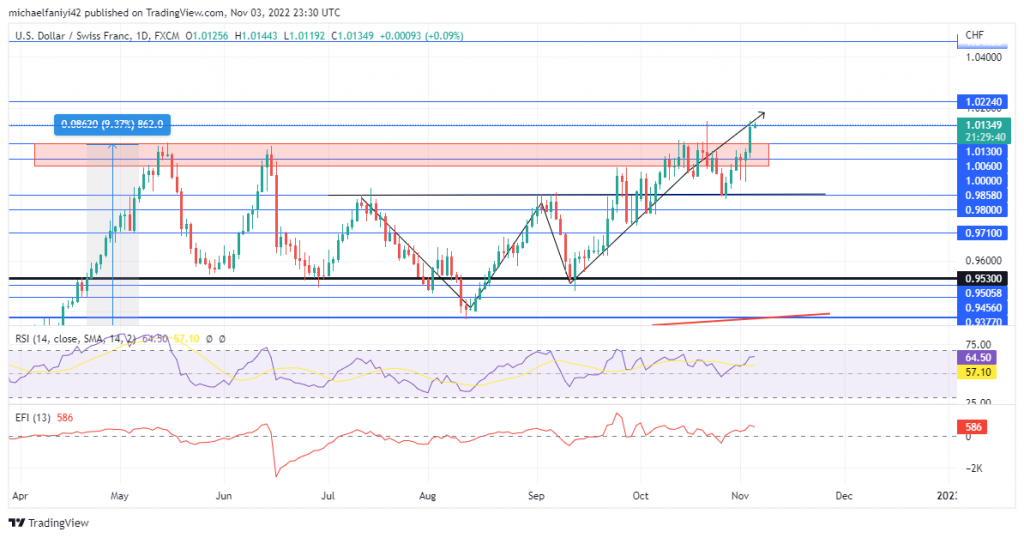
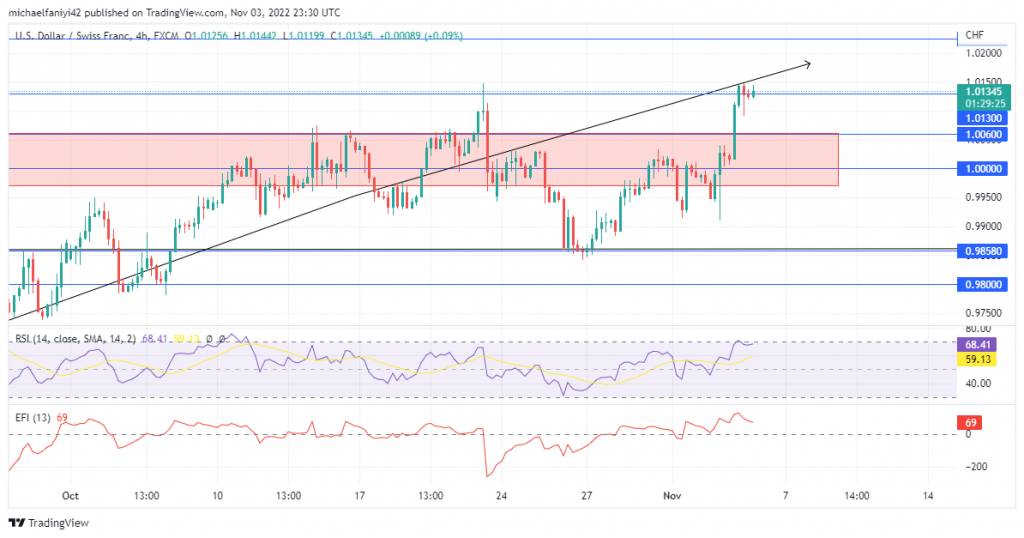
USDCHF retests the 0.98580 necklines and then surges upward and breaks the strong resistance zone that stretches from 1.00000 to 1.00600. The market can be said to have finally found a way past the strong resistance zone after being suppressed below since the second quarter of the year. The buyers confirmed the market into a double bottom bullish structure to break the limitation.
USDCHF Important Levels
Resistance Levels: 1.01300, 1.02240, 1.04620
Support Levels: 0.95300, 0.98580, 1.00000

Since the rise of the currency pair above the strong resistance level at 0.95300, the price has converted the resistance level into a solid demand base. However, the market now has a new supply level to contend with. The price was consistently rejected around the 1.00000 supply level. At some times, the rejection threatened to derail the market back below the 0.95300 former resistance level.
However, the buyers used their setback for a bullish reversal, by structuring the price into a double bottom chart pattern. Immediately after the execution of the structure, the market gushed upward, making several tests and putting severe pressure on the resistance level. The knockout comes when USDCHF retests the structure’s neckline and bounces upward to finally break the resistance level.

Market Expectation
All the odds are in the buyer’s favor. The RSI (Relative Strength Index) line on the daily chart for the period of the surge beyond the neckline has stabilized above the 50 mark. The breakout then pushes the line to the overbought region’s border. There is more space for upward movement. The EFI (Elders Force Index) line is gyrating in a positive value on the daily chart and the 4-hour chart.
Note: Forexschoolonline.com is not a financial advisor. Do your research before investing your funds in any financial asset or presented product or event. We are not responsible for your investing results.


Leave a Reply