USDCHF Analysis: Price Rebounds Towards Supporting Trendline
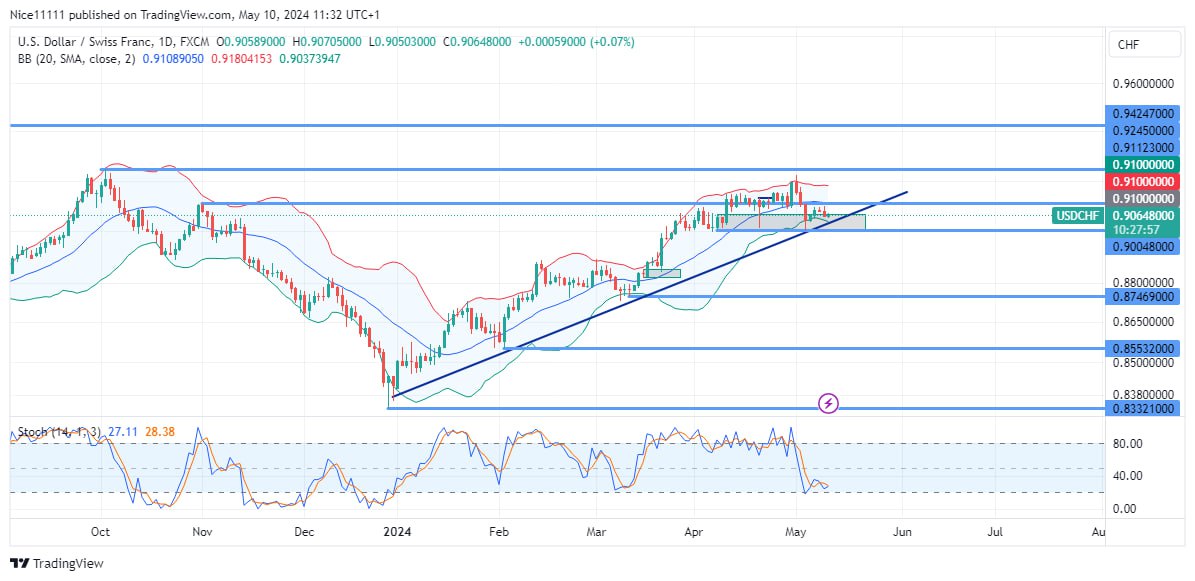
USDCHF has exhibited a notable bullish resurgence, originating from a supportive foundation established at the lower Bollinger Band earlier in 2024. This bullish sentiment was further corroborated by indications of bearish exhaustion highlighted by the Stochastic indicator. Subsequently, the price swiftly ascended above the midline of the Bollinger bands, symbolizing a shift towards a bullish trajectory.
Key Significance Zones for USDCHF
Support Zones: 0.9000, 0.8750, 0.8550, 0.8330
Resistance Zones: 0.9110, 0.9250, 0.9400, 0.9500

The pullback observed in USDCHF’s uptrend has displayed a consistent pattern, characterized by retracements halting and price ascent resuming upon testing the lower Bollinger band. Notably, the swing lows formed during these periods align closely with a bullish trendline, offering valuable insights for predicting future price movements.
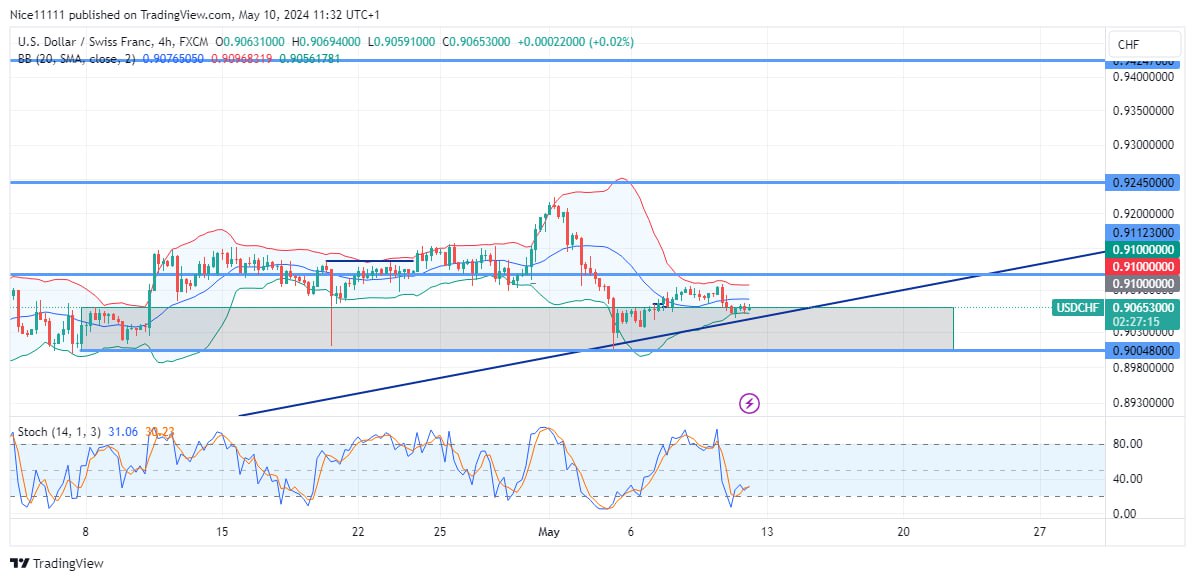
Presently, the price has retraced to the demand level of 0.9000, aligning harmoniously with the established bullish trendline. Furthermore, this pullback has tested the lower Bollinger band, establishing a compelling bullish confluence zone.

Market Expectations
Given the consistent pattern of pullbacks witnessed throughout the year, market anticipation leans towards a resumption of the uptrend. The price is poised to ascend towards the next resistance level of 0.9110. Additionally, the Stochastic indicator signals oversold conditions on both the daily and four-hour timeframes, providing an opportune moment for an optimal trade entry.
Note: Forexschoolonline.com is not a financial advisor. Do your research before investing your funds in any financial asset or presented product or event. We are not responsible for your investing results


Leave a Reply