USDCHF Analysis: The Market Forms a Bearish Trend in a Descending Channel
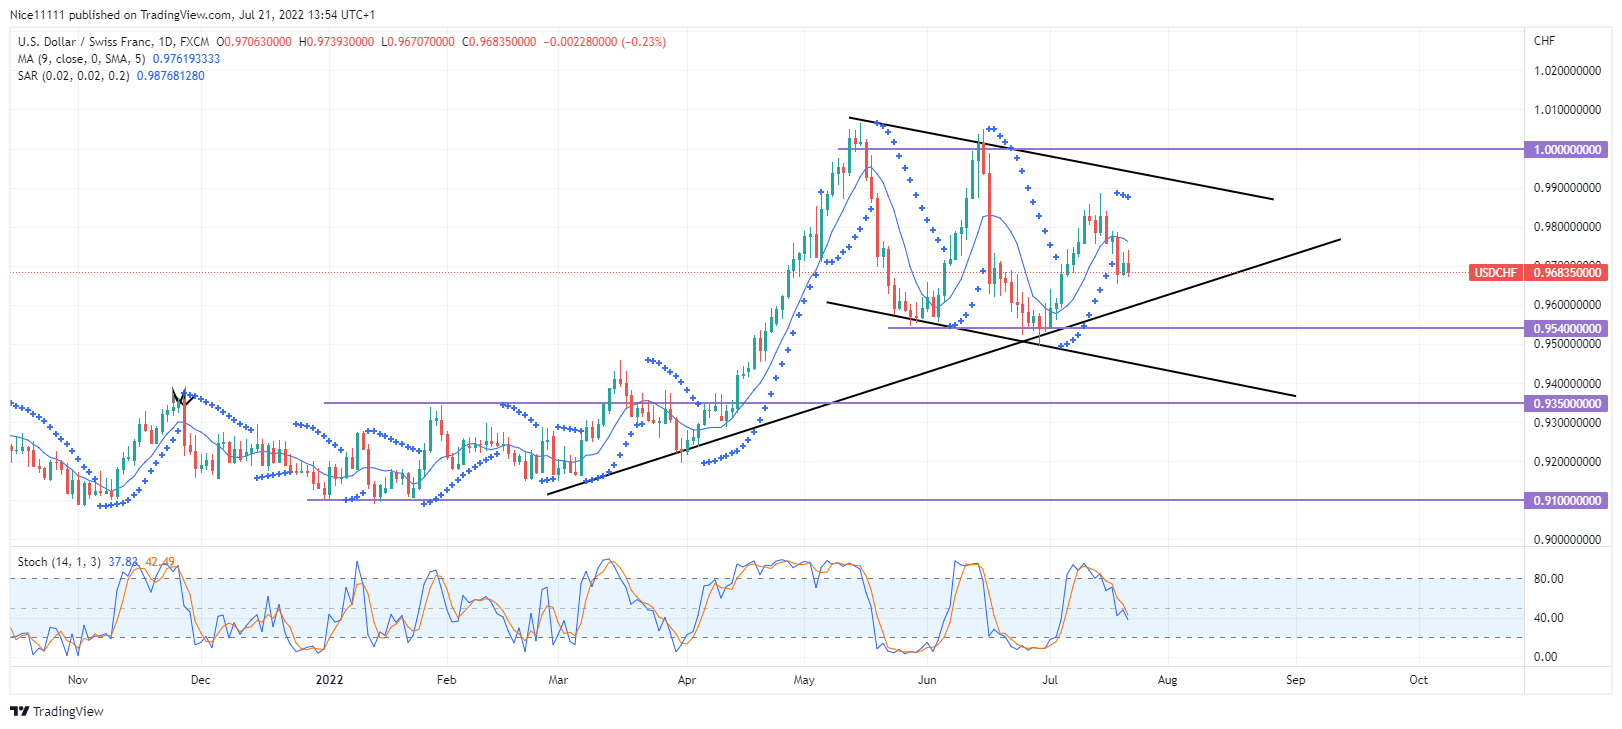
USDCHF forms a bearish trend in a descending channel after several weeks of a bullish trend. The market has found difficulty pushing through the $1.0000 in the market. This has led to a bearish displacement from the critical level at $1.0000.
USDCHF Major Zones
Resistance zones: $1.0000, $0.9350
Support zones: $0.9540, $0.9100 The market was in long-term consolidation on the USDCHF pair from December the previous year until April. The Moving Average Period nine rested on the daily candles during the period of the consolidation. The Parabolic Stop and Reverse indicators also formed points on both sides of the range. The market bounced back and forth between the resistance level at $0.9350 and the support level at $0.9100.
The month of April opened with an oversold market, as seen on the Stochastic. This led to a bullish surge in the market. The month of April was very bullish. The market rose to the oversold region during May. The market faced resistance at $1.0000. The Moving Average switches sides to rest above the daily candles. The Parabolic SAR also formed points above the candles. This led to a crash in the price to $0.9540. The market has formed a bearish channel on the daily timeframe. The bulls tested the resistance level at $1.0000 for the second time this year but failed again.
 Market Expectations
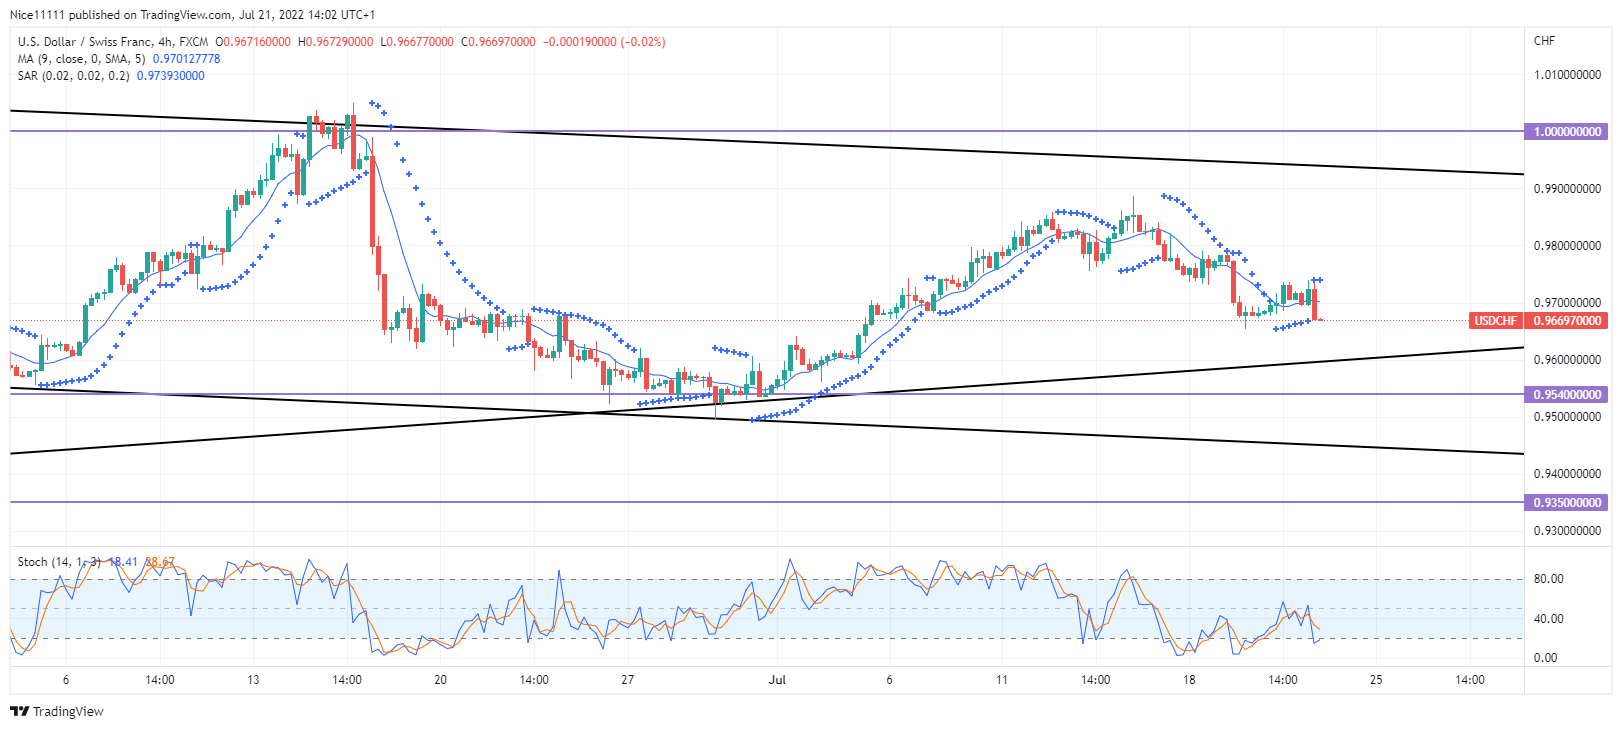
In the four-hour timeframe, the market is bearish. A bullish trend line has been anchored between a low outside the bearish channel and a low within the bearish channel. This is expected to propel a bounce towards the upper trend line to facilitate the fall in price. The market is expected to reach a price of $0.9540.
Note: Forexschoolonline.com is not a financial advisor. Do your research before investing your funds in any financial asset or presented product or event. We are not responsible for your investing results.


Leave a Reply